
GA4 Conversion Rate Reporting: 3 Options in Looker Studio
When working with Google Analytics (GA4) data in Looker Studio, it is possible to receive requests to have your report include insight on the individual performance of GA4 conversions in your Analytics property. Such performance metrics may include conversion counts and conversion rates at both the session and user levels. If you want to learn how to present this information effectively in your dashboard, continue reading, as I will introduce various methods available.
The strategies mentioned in this blog post are designed for situations where your Google Analytics data is linked to your Looker Studio report using the native GA4 data connector in Looker Studio.
For those utilizing BigQuery to stream Google Analytics property data into Looker Studio and aiming to report on individual conversions, you may find that one or two of the methods mentioned in this article are applicable, or you might need to explore a different tactic not covered in this blog post.
In addition to demonstrating these methods practically, I will also discuss some of their limitations.
Prerequisite Step:
Before you can report on individual Google Analytics conversions in Looker Studio, it is essential to have set up some form of conversion tracking and verify that your implementation is capturing the correct data in your analytics property.
If you are unfamiliar with the steps involved in creating a conversion in GA4, check out this article that explains the topic in great detail.
How to Report on Individual GA4 Conversions in Looker Studio
First, here is a list of methodologies you can adopt if you report on the performance of individual Google Analytics (GA4) conversions in Looker Studio. The methods include:
- Utilizing Chart-Level Filters
- Leveraging Conversion-Associated Metrics
- Applying Data Blending Techniques
Let us now look into each of these methods, exploring how they enable us to effectively report on a single Google Analytics conversion in Looker Studio.
Utilizing Chart-Level Filters
This approach is straightforward but has advantages and disadvantages, all of which we will explore.
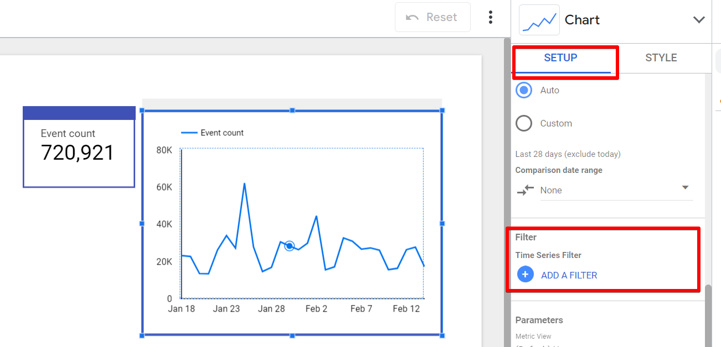
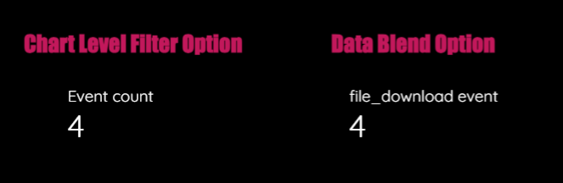
You can consider this approach when working with a scorecard or trend chart visualization component and aiming to report on a specific conversion created in your analytics property or a group of these conversions. It involves creating a filter based on an event name to isolate and include only the conversion event in question.
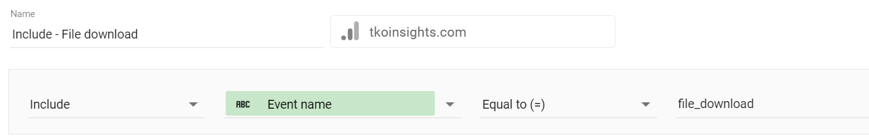
To apply this method, you must add the filter directly to the chart component within Looker Studio. On the “SETUP” tab, proceed to the “Filter” section, and click on the “ADD A FILTER” button, identifiable by a plus sign icon.
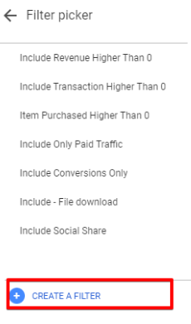
If you have existing filters in your Looker Studio report, select the “CREATE A FILTER” option. If not, you will be directed to the filter configuration and creation screen.
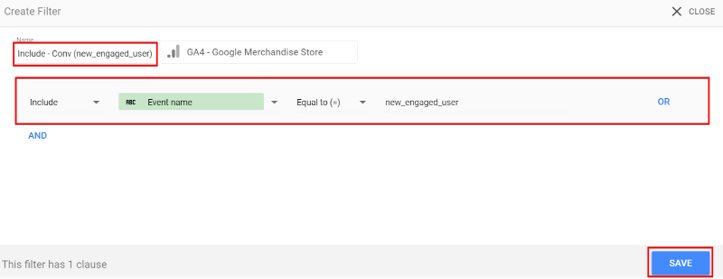
In this screen, give a name to your filter, choose the “Include” filter action, select the “Event Name” dimension field, then select your desired filter condition operator and input the value.
This technique is handy when you need to report on conversion events and would like to include the data before and after you marked it as conversion events in your Google Analytics property UI. It is also beneficial for analyzing a group of Google Analytics conversions. However, be aware of its limitations.
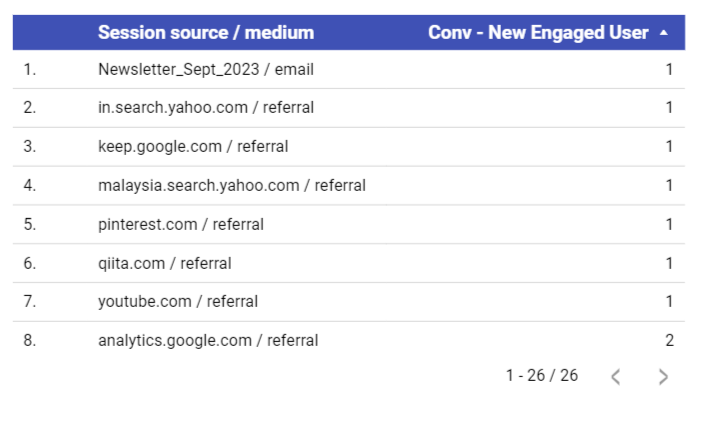
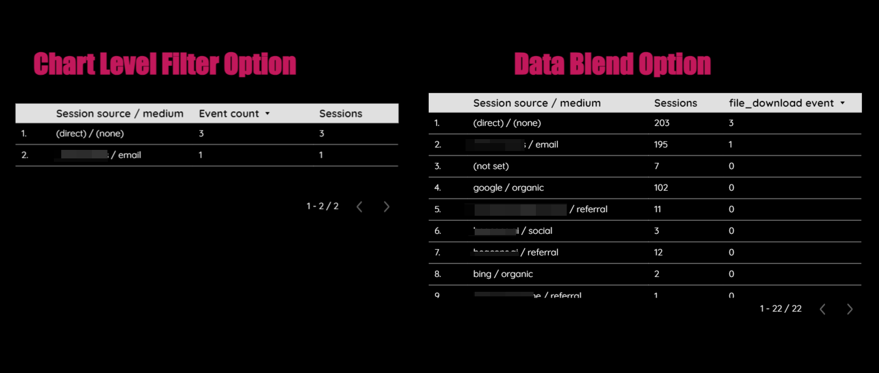
One significant limitation is the inability to use this filtered conversion metric with table charts intended to display dimensions that report zero conversions. For instance, in a traffic acquisition performance report, you might want to include channels that did not contribute to conversions but did generate website visits and traffic. In such scenarios, you may need to consider the second option discussed in this article.
Another drawback is that this method increases the number of filters in your Looker Studio, adding complexity to your existing filter setup.
Leveraging Conversion-Associated Metrics
This strategy makes things cleaner and enhances the usability of the single conversion data in your reports, particularly in addressing conversion metric usability alongside dimension values that report a zero conversion count for specific Google Analytics conversions.
However, it also comes with its set of challenges.
What does this approach entail?
Upon connecting your Google Analytics property data to Looker Studio using the native GA4 data connector, you will automatically see certain conversion-associated metrics listed among your data fields in Looker Studio. These metrics include:
- Conversions: {conversion event}
- SessionConversionRate: {conversion event}
- UserConversionRate: {conversion event}
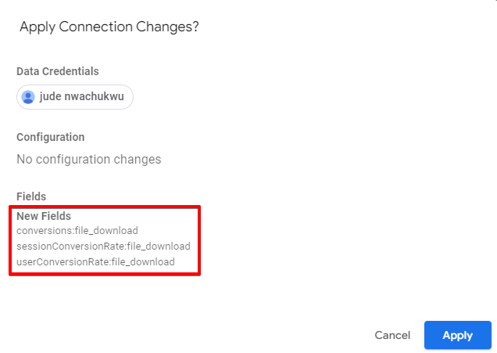
Suppose you do not see any associated metrics for a particular conversion event. In that case, you may need to refresh the data source, which helps update the data fields of your Google Analytics data source.
This article should walk you through how to update your data field.
What do the analytics conversion-associated metrics help you understand?
- Conversions: {conversion event}: This metric represents the total number of times a specific conversion action occurred.
- SessionConversionRate: {conversion event}: This rate indicates the frequency of a particular conversion event within sessions.
- UserConversionRate: {conversion event}: This metric provides the conversion rate of a specific event at the user level.
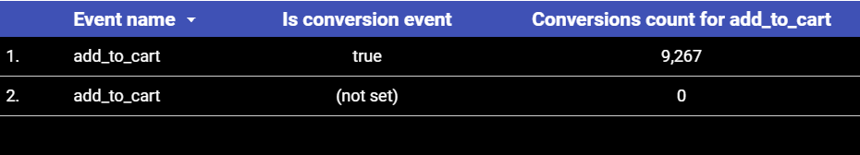
For instance, if you’ve established a conversion event named “upgrade_account” within your Google Analytics property, you should find the following metrics available:
- Conversion count for “upgrade_account“.
- Session conversion rate for “upgrade_account“.
- User conversion rate for “upgrade_account“.
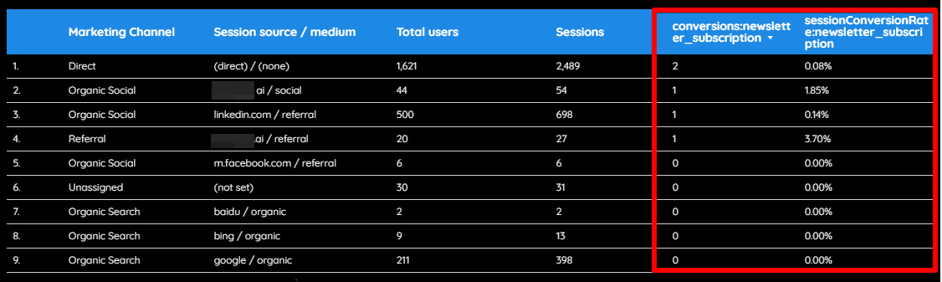
This method simplifies your reporting by reducing the need for multiple filters and allows for integration with dimensions that have not recorded any conversions for those analytics events. For example, in the image below, you can see marketing channels that had zero conversion data but contributed to traffic acquisition in the table.
How do you apply these conversion-associated metrics in your Looker Studio report?
To utilize these metrics, select your scorecards, tables, or trend charts and locate the associated conversion metric (user, session, or event scope). Drag it into the “Metric” section of your chart to proceed.
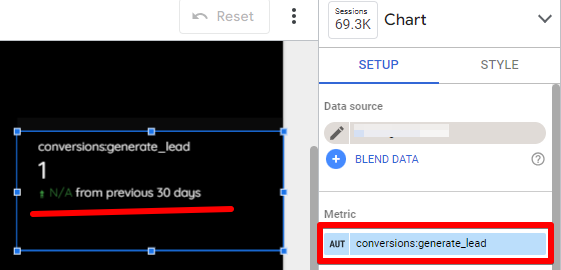
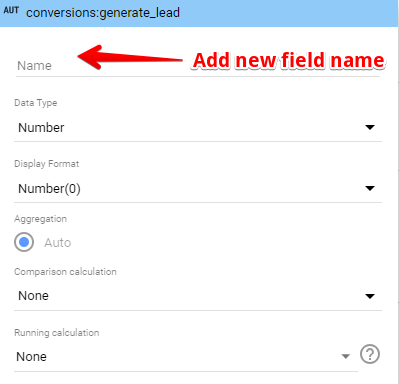
If a metric name occupies too much space, you can rename it by clicking the pencil icon next to the metric and entering your preferred name in the Looker Studio metric “name field.”
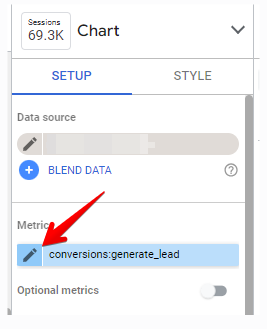
Then, add the new name field.
Using this approach, what are some considerations when reporting single GA4 conversion events in Looker Studio?
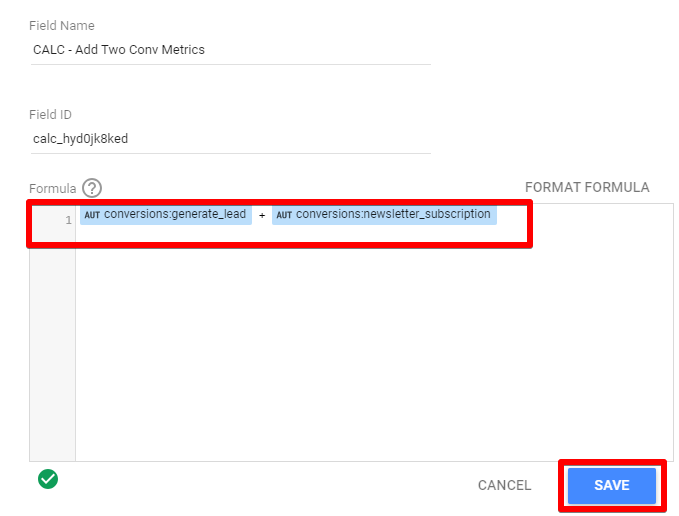
The first con is that this direct approach may not be feasible out of the box for reports that feature a scorecard displaying a total of two or more GA4 conversion events but not every conversion event from your Google Analytics (GA4) property. Instead, a workaround you might adopt is using a “calculated field” to sum up these events using the associated conversion count metrics.
A limitation of this method is that it only counts GA4 events with the “is_conversion_event” parameter set as “true,” omitting events recorded before they were marked as conversions in Google Analytics UI.
For example, if you have an event named “order_accept” and the event has been happening and recording data in GA4 before you marked the “order_accept” event as a conversion, then in Looker Studio, the data that the conversion-associated metric will show will start from when you designate the event as a conversion.
If you need to include data from before and after an event was marked as a conversion, you might have to revert to using chart-level filters, as discussed earlier.
While there have been reports of bugs when these data fields were initially added to Looker Studio (the ones known to have usage issues are the “conversion count for {conversion event}” type of metrics, which can be found in older GA4 integration with Looker Studio, which hasn’t been recently updated), recent tests have shown no issues. However, be aware of potential scope incompatibility. Despite these drawbacks, this method is highly effective for reporting on individual GA4 conversions in Looker Studio.
Using Data Blends
Data blending is also one of the techniques that you can adopt for reporting on specific Google Analytics conversions within Looker Studio dashboards. This method can quickly transition from straightforward to intricate, so I recommend not using this method as the initial approach. The use of “data filters” is crucial for enabling this method.
What do I mean by using data blends for reporting single or group GA4 conversions in the Looker Studio dashboard?
Data blending involves combining data from multiple sources or the same source that might have different configurations.
In the data blends method, we’ll use the same GA4 data source linked to Looker Studio via the Google Analytics native connector.
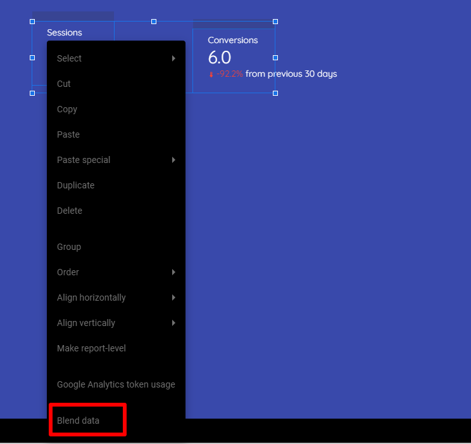
To initiate a blend, you can either right-click on two charts sourced from GA4 and select “Blend Data“.
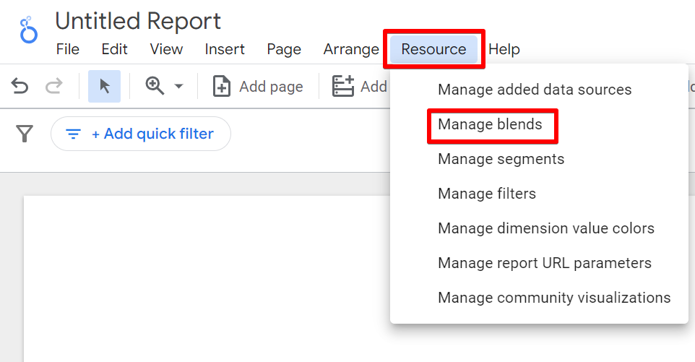
Alternatively, the longer route is to navigate through the “Resource” menu to “Manage blends.”
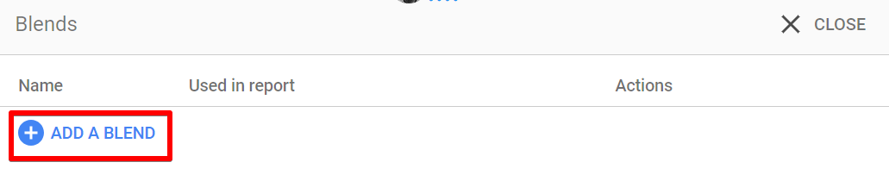
In the ensuing view, click the “Add a Blend” button to create a new blend, select your Google Analytics (GA4) data source, and configure the blend accordingly.
Configuring your Data Blend in Looker Studio
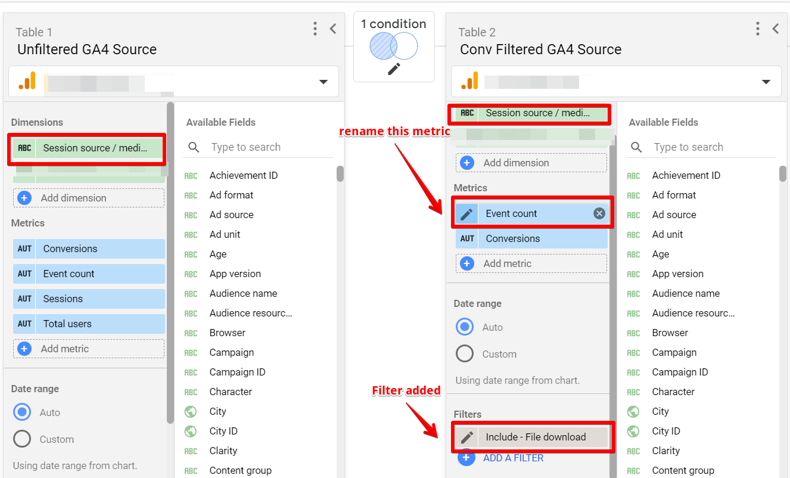
In the blend configuration view, you should include relevant dimensions and metrics for each table involved. Essential metrics such as “Conversions” and “Event Count” must be added to the second (LEFT) table; ensuring these metrics are also present in the first table is beneficial for subsequent testing. The first table should contain additional dimensions for a more detailed analysis possibility.
Upon completing these steps, apply an “Include Event” filter to the second table (LEFT), focusing on the specific GA4 conversion event you wish to analyze.
To avoid confusion between similar metrics across tables, consider renaming the conversions and event count metrics in the second table to reflect the “event name” followed by “conversion” (e.g., “generate_lead conversion”). This clarification aids in distinguishing between the metrics.
To complete the blending process, ensure the join operator is a “LEFT JOIN,” using the event name or an appropriate attribution dimension as join keys. After setting this up, save your blend.
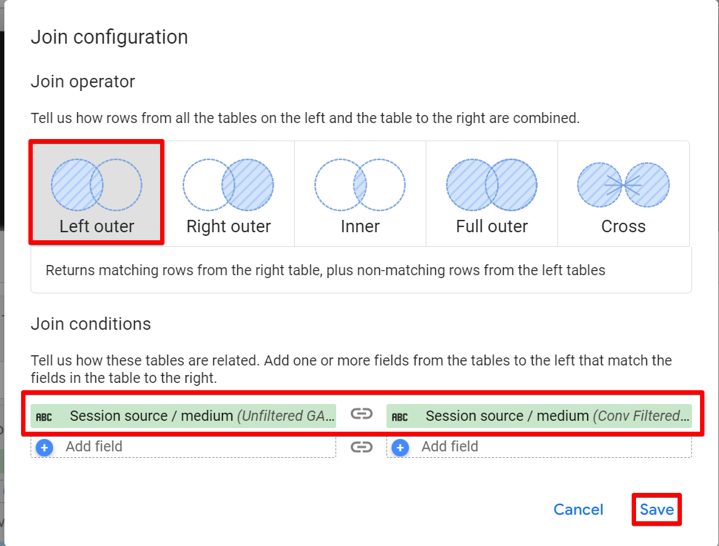
Here is a complete configuration of your blend.
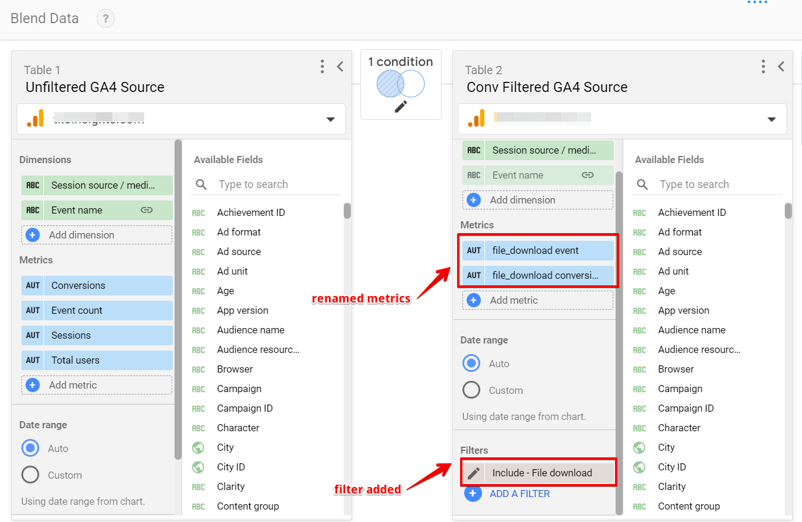
Doing this now allows you to create a scorecard chart utilizing the “event count” metric you renamed during the blending process.
The real advantage of this technique becomes apparent when dealing with a table chart that evaluates marketing channel performance in terms of user acquisition, website visits, and conversions and where you’d like to include all channels, both effective and ineffective tactics.
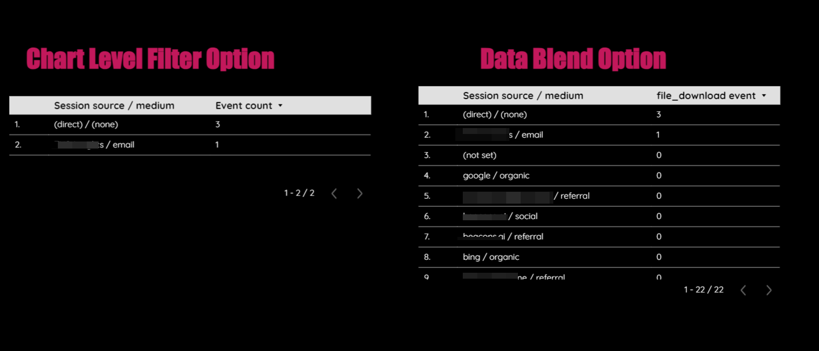
To accomplish this, add the dimensions for marketing session sources and mediums alongside metrics for sessions and users and the conversion event count or conversion metric you’ve renamed for easy usability. This setup allows for a comprehensive view of channels contributing to website conversions and those that do not.
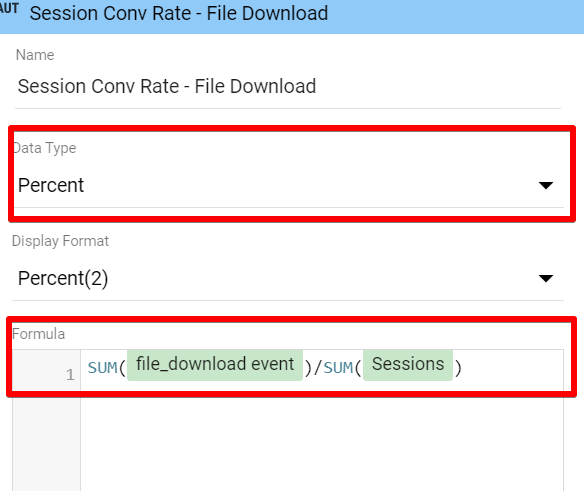
Within such a chart, the blend includes metrics like session and user conversion rates for the specified conversion, achievable through calculated fields and respective formulas below.
- Session Conversion Rate: SUM(CONVERSION event)/SUM(Sessions)
- User Conversion Rate: SUM(CONVERSION event)/SUM(Total Users)
In Conclusion
We have explored various methodologies for reporting specific or multiple Google Analytics conversions within Looker Studio reports. I outlined each method’s advantages, limitations, and potential application scenarios.
I am eager to hear which of the discussed strategies you plan to implement in your reporting project. What are your key takeaways from this article? Feel free to share your insights and experiences in the comments section below.
Until the next blog post, happy analyzing.

")
")


Trackbacks & Pingbacks
[…] to do GA4 conversion rate reporting in Looker Studio (key event […]
Leave a Reply
Want to join the discussion?Feel free to contribute!