
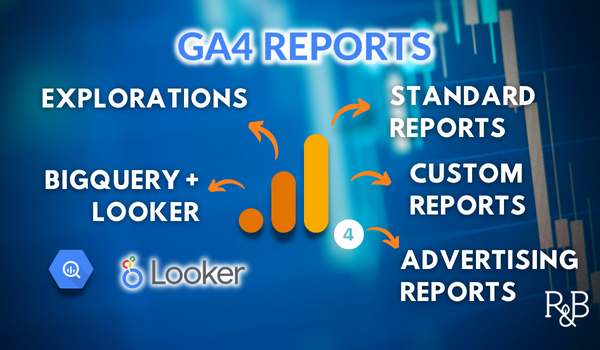
GA4 Reports: Standard Reports, Explorations, Custom Reports, and More
GA4 reports function quite differently than reports in Universal Analytics. In this guide we’ll explain Standard Reports as well as the more advanced “Explorations.” We’ll also review Advertising Reports and provide tips for creating custom reports. Finally, we’ll touch on the role BigQuery and Looker Studio can play in reporting. Get ready for some serious Google Analytics reporting.
We’ll cover 7 things in this reporting-centric blog post.
- Overview of GA4 Reporting: Standard Reports vs. Explorations vs. Advertising Reports
- GA4 Standard reports (and how to customize them)
- GA4 Explorations
- GA4 Advertising Reports
- Custom reports in GA4
- GA4 Reporting With Looker Studio
- GA4 Reporting With Google BigQuery
Let’s get started!
Overview of Google Analytics 4 Reporting
Compared to Universal Analytics (UA or GA3), the new GA4 has far fewer reports out of the box. This is just one of the many differences between Google Analytics 4 and UA. This is partially because the data model is completely new in GA4. The Google Analytics data model is based exclusively on capturing web interactions (“hits”) as events. So all reporting in GA4 relies on those events. That means some of the popular reports in Universal Analytics that were based on page views, user timing, and sessions are simply not available.
A further difference seems to be in the design and UX philosophy for the GA4 interface. UA seems purpose built to serve as a suite of pre-made reports. There are over 30 of them out of the box! While some of us exported our data from UA, these standard reports served perfectly well for most data needs. GA4 is not built as a collection of pre-made reports. Instead of over 30 reports like in UA, there are less than half as many reports in GA4!
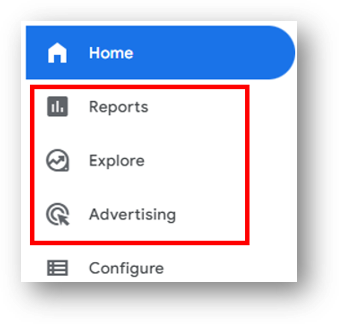
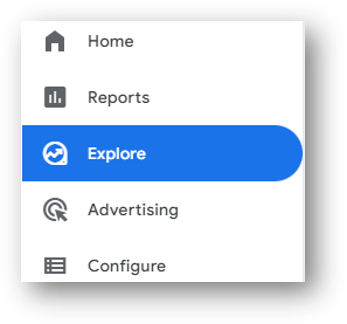
But despite the lower overall count in GA4, reports still feature prominently in the platform navigation. Each of the three menu items in the red box below represent a distinct reporting function in GA4.
Let’s start with the first of these on the list: Standard Reports.
GA4 Standard Reports
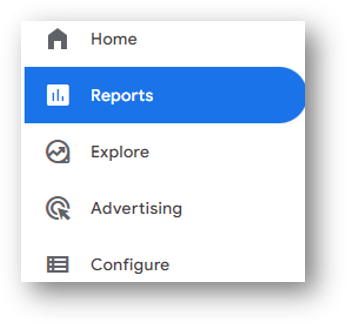
You can access Standard Reports by navigating to “Reports” as shown below.
Standard GA4 reports include the “Reports Snapshot” (a quick glance of performance without deep insight), the “Realtime” report, as well as “Life cycle” and “User” reports.
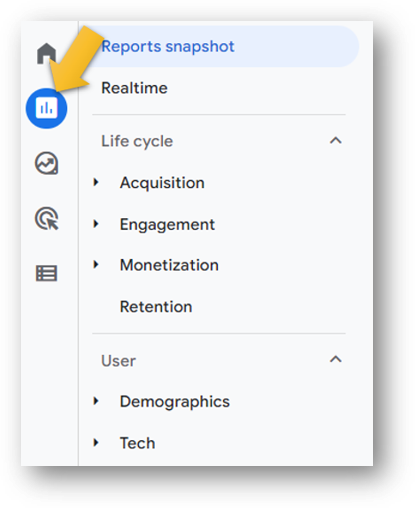
The majority of the reports live in the Life Cycle area. This includes reporting focused on Acquisition, Engagement, and Monetization.
- Acquisition: how visitors arrive on your site
- Engagement: what visitors do on the site after they arrive
- Monetization: how the site is performing in terms of dollars and cents (only available for Ecommerce sites or publishers)
User reports are focused on Demographics and Tech.
For a complete review of these reports, check out this GA4 Standard Reports explainer.
Explorations in GA4
According to Google’s support documentation, “Explorations is a collection of advanced techniques that go beyond standard reports to help you uncover deeper insights about your customers’ behavior.”
Some of these Explorations are pre-configured and are quite similar to some of the standard reports that we had in the days of UA. Some are entirely new. And there is also the ability to create a brand new Exploration from a blank canvas and pull in your own dimensions and metrics.
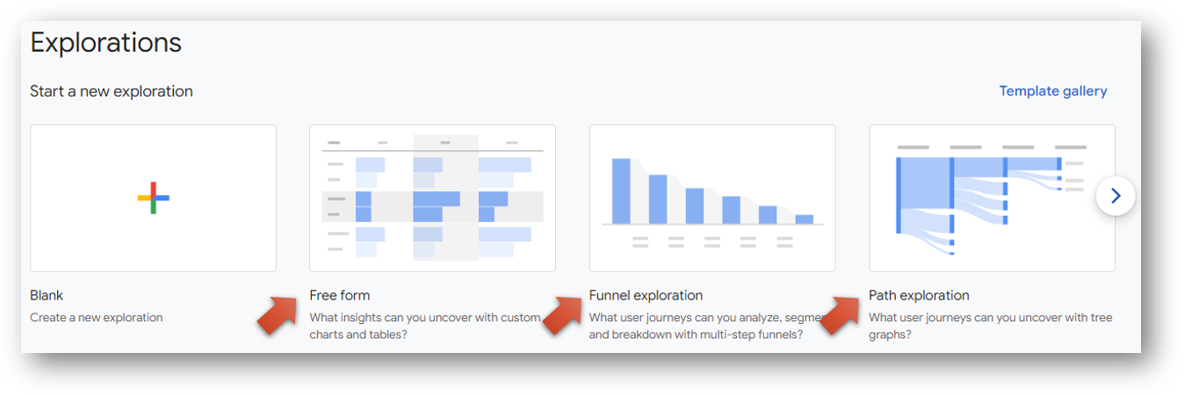
Explorations live immediately below the Standard Reports in the GA4 left-hand navigation. Check that out below.
There are multiple Explorations including Funnel exploration, Path exploration, and Free form. It’s also possible to start from scratch with a Blank exploration and select your own metrics, dimensions and metrics to build your own report.
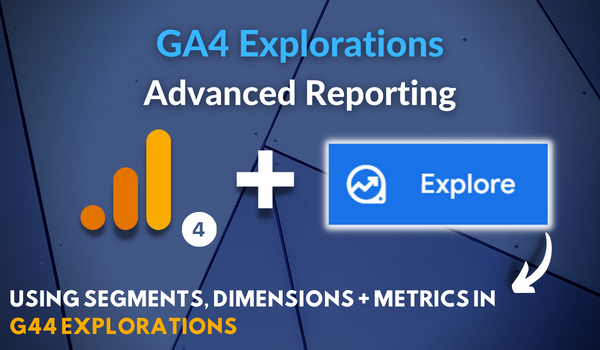
To go deeper into Explorations, click the image below or this link to the GA4 Explorations guide on this site.
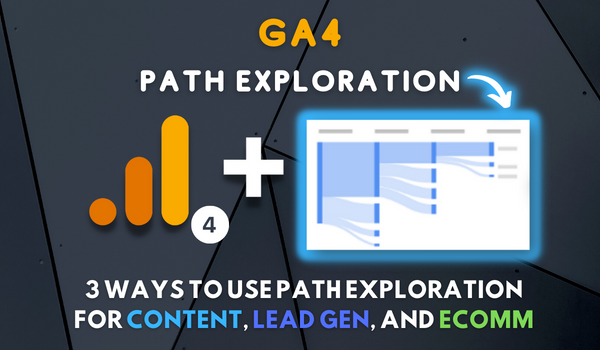
One Example of a GA4 Exploration
One great option in Explorations is the Path exploration report, which allows you to see precisely what your visitors are doing before (or after) they take a key action on the site. Check the link in the preceding sentence if you want to see how path analysis can be helpful regardless of whether you have a content site, a lead generation site, or an Ecommerce site.
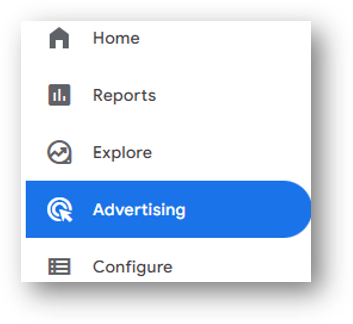
GA4 Advertising Reports
Advertising Reports provide insight about conversions and conversion paths. You navigate to Advertising Reports by selecting “Advertising” from the left-hand navigation menu. Shocking, no?
Advertising reports are designed to answer questions like these:
- Which traffic channels drive the most conversions?
- What touchpoints do customers take before they convert?
- How do various attribution models compare?
- Which “campaigns” drive the most conversions?
The Google Analytics Advertising Reports can help you understand how your site best produces conversions. Once you know which channels are campaigns are most effective in driving conversions, you can adjust your marketing decisions (internal resources, focus, budget, etc) with the aim of prioritizing what is working best.
GA4 Custom Reports
There are multiple ways to create custom reports in GA4. Standard Reports can be modified and saved as new custom reports. So can Advertising Reports. Explorations can be customized from scratch to provide targeted and custom answers.
The process of creating a custom report will vary based on what type of report you want to build. Here are further resources about creating GA4 custom reports.
- How to customize a GA4 Standard Report that functions almost like a “View” from the days of Universal. Check out this blog post.
- How to create a custom Source / Medium traffic acquisition report in GA4. Watch this video tutorial.
- How to create a custom Campaign report in GA4 to report on your UTM tagged traffic. Review this video explanation or read the GA4 and UTM explainer.
- How to use Explorations to build a report showing your embedded YouTube video views. This video explains how to build a report showing video starts and completions. Want to see video progress as well? Check out this video guide.
- How to use Explorations to select your own dimensions, metrics, and segments to show site traffic and engagement trended over time. Here’s the video for that.
Compared to Universal Analytics, we should be prepared to make more use of custom reports to get what we need from GA4.
GA4 Reporting With Looker Studio
Visualizing your reports can get a power boost with a free tool called Looker Studio.
What is Looker Studio?
Formerly called Google Data Studio, Looker Studio is a free tool that can help transform GA4 data into customizable dashboards and reports. This is a powerful tool that also comes with some potentially important limitations.
![]()
![]()
Looker Studio works by connecting with your GA4 data through an API. That makes the data available for use in those dashboards and reports. We’ll share some links to some Looker Studio reports that we’ve found helpful, but first we should explain about the API and some limits to be aware.
The GA4 Data API
This is where we need to exercise some caution.
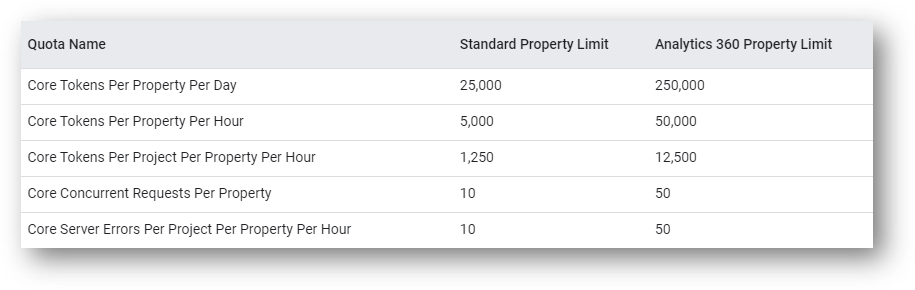
Looker Studio relies on “tokens” to process data. There are 3 different types of these tokens, but the primary type is something called “Core tokens.” For a standard GA4 property connected to Looker Studio, you can use up to 1,250 of these tokens per hour and up to 25,000 tokens a day. Here’s a table showing Core token quotas for a standard (unpaid) GA4 property and a paid GA 360 property. This table, and associated information, is from this Google resource explaining quotas for the API.
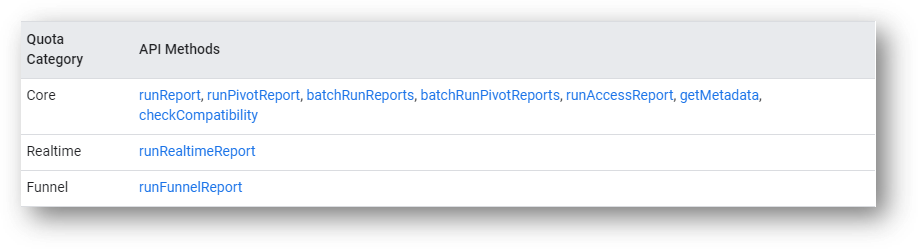
As Google says, each “API request verifies quotas have not been exhausted and consumes quotas”. If a quota has been fit, the request to the API will fail. There are 3 different buckets of quota limitations. We’ve already talked about the first bucket: Core tokens. The Core tokens refer to all API requests that are not related to the Realtime and Funnel reports. The other two types of types of tokens refer to those much more limited reports.
Three Types of “Tokens” For API Calls
We’ve already covered the most important bucket here. But since we started down this path, let’s review the other two as well.
- Core: all API requests that aren’t related to the two API methods detailed immediately below
- Realtime: requests related specifically to the the runRealtimeReport API method (see below)
- Funnel: requests related specifically to the the runFunnelReport API method (see below)
Some GA4 Reports We Can Build in Looker Studio
Here are three of our favorite GA4 reports to build in Looker Studio.
This report tutorial walks through how to build a conversion and conversion rate report in Looker / Data Studio.

Create a report showing all of your internal site search data with this report in Looker Studio / Data Studio.
Interested in seeing what links are clicked on your site? This report explainer shows all internal and external links clicked.

Hope this helps you get started if you’re interested in exploring Looker Studio!
Google BigQuery and GA4
What is Google BigQuery?

Well, here’s what Google says:
BigQuery is a fully managed enterprise data warehouse that helps you manage and analyze your data with built-in features like machine learning, geospatial analysis, and business intelligence.
Google Analytics 4 comes with a free connection to Google BigQuery. This integration was only available for the paid enterprise plans in the days of Universal Analytics.
The BigQuery connection is definitely an advanced feature for GA4 reporting. BigQuery is primarily used to manage and transform data and then it is sent to a visualization tool like Looker Studio for shareable reports.
If you want to get started, this guide to the GA4 and BigQuery connection is the place to start.
Wrapping Up
Looking for something else? Feel free to leave a note in the comments or on the Root and Branch YouTube channel at youtube.com/@rooted-digital. We’re always looking for new content ideas!
Don’t forget that Universal Analytics data will no longer be processed in that platform beginning July 1, 2023. In other words, now is the time to get more comfortable with GA4.
About Root & Branch
Root & Branch is a certified Google Partner agency and focuses on paid search (PPC), SEO, Local SEO, and Google Analytics. You can learn more about us here. Or hit the button below to check out YouTube for more digital marketing tips and training resources.


")


")

Trackbacks & Pingbacks
[…] where it is processed and transformed into reports. That is the data that we can then see in our GA4 reports and […]
[…] unlike UA, you view your Google Analytics reports at the Property level in GA4. There are no views in GA4, although you can create filters to […]
[…] largest and most popular web analytics tool is Google Analytics 4 (GA4). It is full of built-in reports (like the one below) to help you understand how visitors arrive on your website and what those […]
[…] You can find the session_start event in you Events report within your collection of GA4 reports. […]
[…] see the event named ‘click’ in your GA4 reports. Each time there is an outbound click on your website, the ‘click’ event will fire and […]
[…] in report for Source / Medium in Google Analytics 4. It’s one of the many differences in GA4 reports compared to the prior version. Fortunately, we can easily built our own custom source / medium […]
[…] are some clear benefits to turning on Google Signals, particularly as it relates to advertising and reporting functionality. But there are also downsides to be aware […]
[…] You can find it in you Events report within your collection of GA4 reports. […]
[…] The links below show how to replicate a version of the Source / Medium report and the Campaigns report in GA4. I wouldn’t say they are perfect, but they can be helpful nonetheless. And if you’re really interested in understanding reporting, you can check this guide to GA4 reports. […]
[…] Google Analytics is a comprehensive digital analytics tool that provides a picture of how your visitors arrive on your website. It also shows what kind of activities they engage in after they arrive through numerous detailed reports. […]
[…] 45%. And so on and so forth. For this season, you certainly might choose to add bounce rate to your GA4 reports but it’s likely extraneous information if you’re already looking at engagement […]
[…] comprehensive guide to Google Analytics reports. This includes both standard reports and the “advanced reporting features” known as […]
[…] GA4 standard reports, the limited information that we do have on returning users is in the “Retention” […]
[…] same approach will work if you’re building an Exploration for your GA4 reporting. That’s […]
Leave a Reply
Want to join the discussion?Feel free to contribute!