
GA4 Standard Reports Explained
GA4 standard reports are arranged quite differently than the standard reports in Universal Analytics. To start, there are fewer of them, and they are also not all a 1:1 match. In this guide we’ll explain standard reports and we’ll provide tutorials on how customize them to build some of the most useful Google Analytics 4 reports.
We’ll cover 5 things in this blog post.
- A brief overview of reports in GA4, including Standard reports vs. “Explorations”
- Navigating to standard reports in GA4
- Acquisition reports in GA4
- Engagement reports in GA4
- Monetization reports in GA4
You can read on below to get started, or check out this embed below if you’d prefer a video review.
An Overview of Reports in GA4
Compared to Universal Analytics, GA4 reports (link to top level cluster) are significantly different. This is just one of the many differences between Google Analytics 4 and UA. This is partially because the data model is completely new (exclusively event based in GA4), which means that some of the reports in UA based on sessions and pageviews are simply not available.
It’s also because the setup and navigation and setup of GA4 is quite different compared to UA. In GA4, reports are bucketed in two main areas: “Standard reports” and “Explorations”.
Standard Reports and Explorations in GA4
While all reports accessible in Universal Analytics were standard reports (which could be customized as needed), GA4 has both Standard reports and “Explorations.” According to Google, Explorations is a collection of advanced techniques that go beyond standard reports to help you uncover deeper insights about your customers’ behavior. This particular guide is all about the Standard reports. For more about Explorations, check out this GA4 reporting overview.
The Number of Standard Reports in GA4 vs. UA (GA3)
Universal Analytics was built to serve as a suite of pre-made reports. There are over 30 of them out of the box! While some of us exported our data from UA, these standard reports served perfectly well for most data needs. GA4 does not seem to have been built with the same philosophy. It is not a collection of pre-made reports. Instead of over 30 reports like in UA, there are less than half as many reports in GA4!
Here’s how you navigate to them.
Navigating to Reports in GA4
Google Analytics standard reports “live” in the left-hand navigation within the GA4 interface. Standard reports are pre-built and are generally the closest corollary to reports in UA.
You can navigate to these reports by hitting the “Reports” button from the left-hand navigation (see the yellow arrow below).
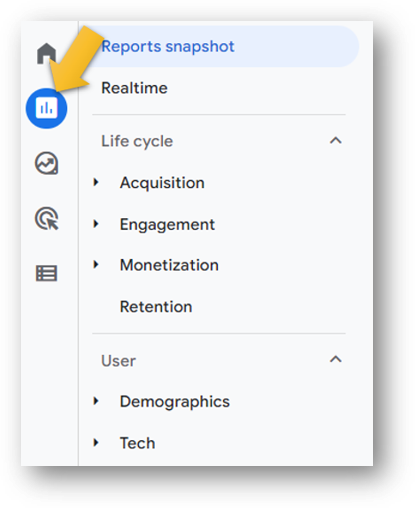
Those Explorations mentioned previously are found in the magnifying glass icon right below the report icon.
But let’s now go deeper to review the Standard reports.
Standard Reports in GA4
Standard GA4 reports include the “Reports Snapshot” (a quick glance of performance without deep insight), the “Realtime” report, as well as “Life cycle” and “User” reports. The majority of the reports live in the Life Cycle area, and we’ll review those Acquisition, Engagement, and Monetization reports in detail below. But first, let’s take a quick stop to visit the realtime report.
The Realtime Report
The Realtime report can be fun to get a glance at what is happening on your site or app right now and can diagnose what might be causing any major traffic spikes. It reports on all users within the last 30 minutes and gives a snapshot of activity.
As you can see below, we get a total count of users (top left) as well as a cool map so you can see where the activity is taking place.
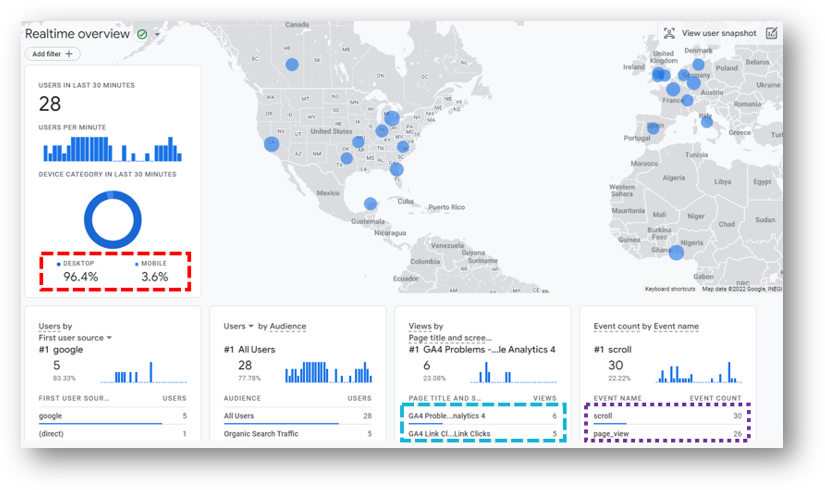
I particularly like to see the device category breakdown (red box). Root and Branch visitors often tend to engage with content with 10 minutes for more, so it’s not surprising that it’s almost all on Desktop. You can also see what pages are particularly popular at that time and what events are taking place.
The Life Cycle Reports
Most of the real value in the GA4 Standard reports lives in the Life cycle reports.
In particular, the Acquisition reports, Engagement reports, and Monetization reports have detailed reports that can provide useful insights for the business.
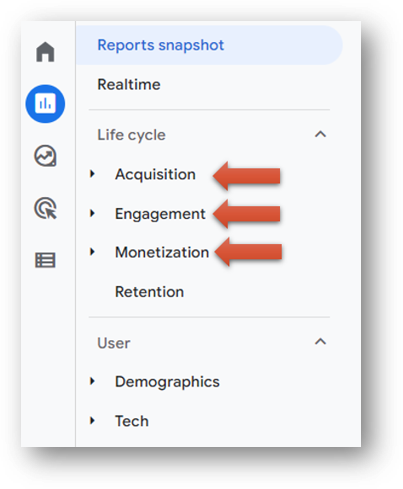
Acquisition Reports
The Acquisition reporting area focuses on how your visitors arrive to your website. How are they “acquired”? This includes Acquisition overview, User acquisition, and Traffic acquisition as you can see in the red box below.
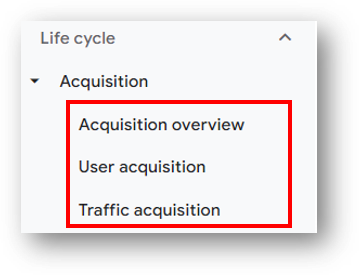
The User acquisition report includes details on traffic sources based on user activity. The Traffic acquisition report is similar, but focuses on Sessions rather than Users. The overview provides a snapshot of users and sessions and also pulls in data from Google Ads and Google Search if you’ve set up those integrations for your GA4 property.
All of these reports can be customized and can be saved as new reports that help to replicate some of the most popular reports from UA. Here are some tutorials on how to that if you’re interested.
- How to create a Source / Medium traffic report in GA4 (video)
- How to create a Campaign traffic report in GA4 (video)
- How to customize reports to help replace the “View” functionality from UA
- How to link Search Console and GA4 (video)
- How to link Google Ads and GA4 (video)
Engagement Reports
While the Acquisition reports focus on how visitors arrive on your site, the Engagement reports focus on what they do after they arrive.
The standard Engagement reports include an Engagement overview, Events report, Conversions report, and Pages and screens.
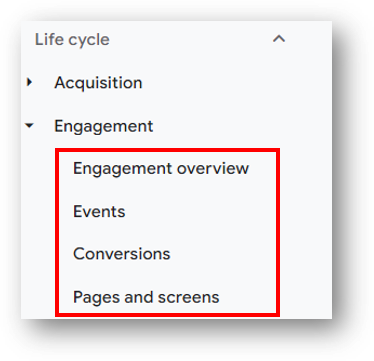
The Events reports lists all events that have taken place on the site during the time period you’re analyzing. Conversions focuses on only the specific events that you have marked to be registered as conversions.
Pages and screens is somewhat comparable to the All Pages report from the days of Universal Analytics. It includes information about how your visitors are interacting with the most popular pages on your site. You can customize this report to replicate a version of the Landing Pages report from UA.
- How to create a Landing Page report in GA4 (video)
Monetization Reports
Monetization reports are only relevant for businesses that have monetized their web site or app (shocking, I know!).
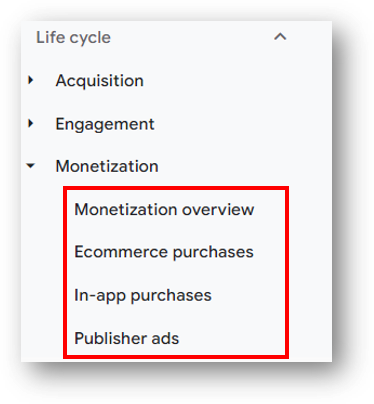
Ecommerce purchases are relevant only for Ecomm stores. In-app purchases for apps with purchase functionality. Publisher ads is for those websites that have monetized their traffic by selling ad inventory. The Monetization overview report will show data if there is data in one or more of the 3 reports below. The GA4 property for the Google Merchandise store, for example, only has data for Monetization overview and Ecommerce purchases.
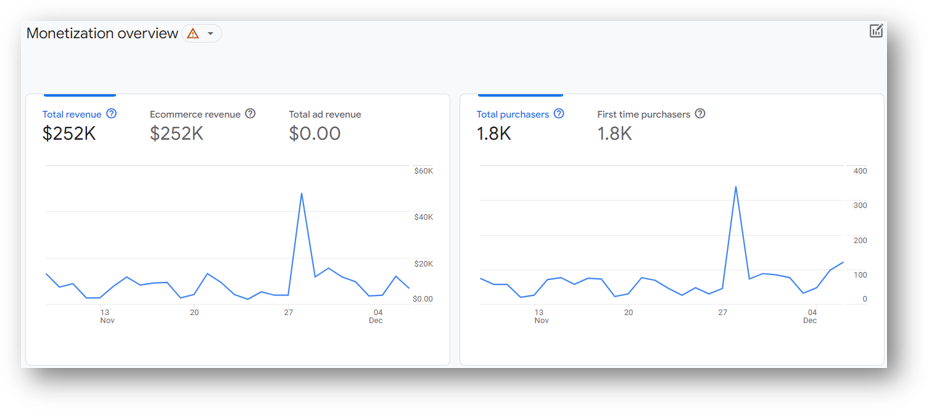
Here is a screenshot from their Monetization overview showing $252k in total sales during the time period in question. We can also see that there were 1,800 total purchasers during this time frame and that they were all recorded as First time purchasers. You can also see a big ‘ol $0 for Total ad revenue as the Google merch store is not monetized through ads.
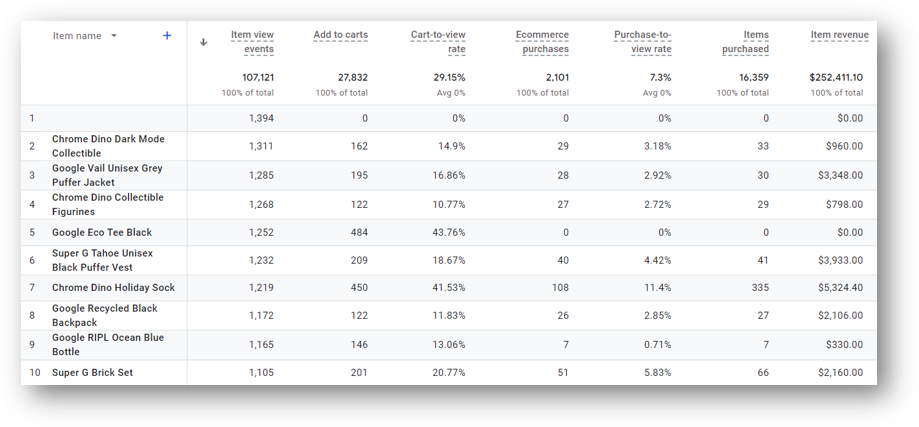
Here’s what the helpful Ecommerce purchases report looks like. This includes metrics like Item views, Add to carts, purchases and revenue, as well as calculated metrics like Cart-to-view rate and Purchase-to-view-rate.
The only other report in the Acquisition report is about Retention. This is where you can see your audience based on New vs. Returning users and various cohort views as well.
User Reports
There are two sections of User reports in GA4: Demographics and Tech.
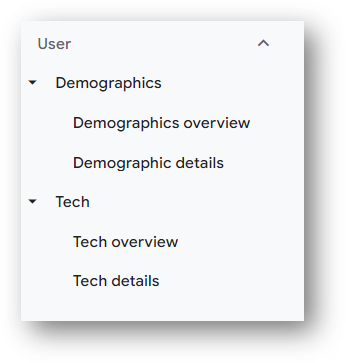
Let’s explore them both, starting with Demographics.
Demographic Reports in GA4
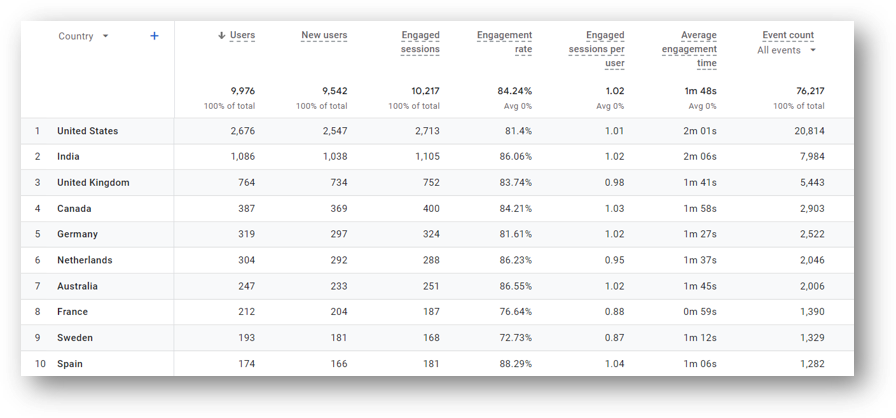
The Demographic details report will show User behavior based on dimensions like Country, Region, City, Language, Age, and Gender. You can see an example below for the Root and Branch site based on the Country dimension. It looks like visitors from places like the US, Canada, the UK, and India are most engaged based on engagement rate and average engagement time. Visitors from France and Sweden are not as engaged, especially when you focus on engagement rate.
You can change the primary dimension (check the small down arrow next to Country in the upper left) to build a new report, or add a secondary dimension using the blue plus sign to the right of Country. The Demographics overview report will show a higher level view of this report, with multiple dimensions displayed on different cards of report snapshots.
There seem to be fewer audience details available in GA4 when compared to what was available in UA. This follows a trend of privacy concerns leading to fewer demographic details being available.
Tech Reports in GA4
The tech reports in GA4 report on dimensions like browser, device type, device category, device model, screen resolution, platform, operating system and more. You can change the primary dimension in the same manner that we did in the Demographic details report to slice your user data based on any of the tech dimensions.
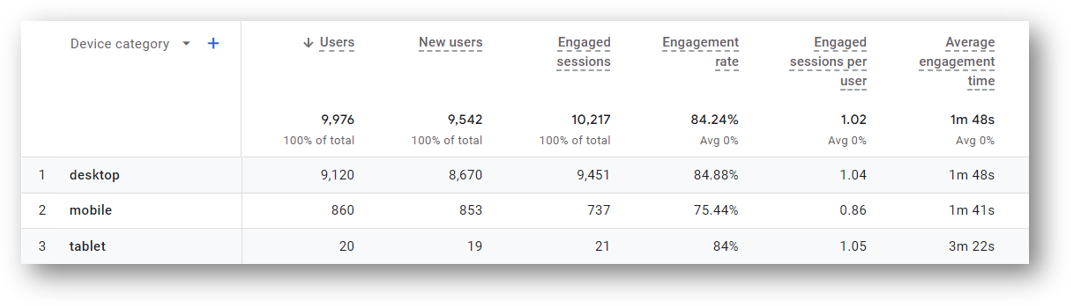
For example, here’s a report showing performance based on Device category. This was a stand-alone report in UA but it’s clearly not too much trouble to replicate it here in GA4.
More GA4 Reporting
That wraps things up for the GA4 Standard reports. These are quick, easily accessible reports that provide highlights on performance at a glance. We can customize them and even save those custom versions as new reports accessible from the left-hand navigation.
They are not designed for deep dives. For that, we are getting into the area of Explorations and reporting with Looker Studio. Check out those prior links if you’d like to read more. Thanks for reading!
Wrapping Up
Looking for something else? Feel free to leave a note in the comments or on the Root and Branch YouTube channel at youtube.com/@rooted-digital. We’re always looking for new content ideas!
Don’t forget that Universal Analytics data will no longer be processed in that platform beginning July 1, 2023. In other words, now is the time to get more comfortable with GA4.
About Root & Branch
Root & Branch is a certified Google Partner agency and focuses on paid search (PPC), SEO, Local SEO, and Google Analytics. You can learn more about us here. Or hit the button below to check out YouTube for more digital marketing tips and training resources.


")


")


Trackbacks & Pingbacks
[…] can also see the search term info in GA4 standard reports if you use a custom dimension to register the search term event parameter. No worries if […]
[…] “Reports” section of the GA4 interface. You can see that below. For a full review, this guide to standard reports has the […]
[…] a complete review of these reports, check out this GA4 Standard Reports […]
[…] collections, or sets of reports, such as the Life Cycle collection and User collection. These GA4 standard reports can be customized and saved within collections for easy […]
Leave a Reply
Want to join the discussion?Feel free to contribute!