Google Analytics Definitions: GA4 Defined in 2024
[Updated 3/22/24] There is a lot going on with Google Analytics. This is even more true with GA4 which introduces some new terms. So let’s jump in to this list of Google Analytics definitions and get rolling!
Audience
An audience is a distinct group of visitors on a website (or app). It could be an audience of visitors who have been to the site before. It could be an audience of people who live in a certain country. Or it could be an audience of people who have completed a key goal (a “conversion”) on the website.
There are multiple ways to create audiences in GA4. They can be used for reporting and analysis or for remarketing in Google Ads (or both). Here’s a video explainer of GA4 audiences if you want more.
Audience Trigger
Google Analytics can fire an event every time someone new satisfies your audience conditions and enters your audience? It’s true! This is called an “Audience trigger event” and it can be very helpful for audience management, conversion tracking, and more.
This video is all about audience triggers and shows how to create an audience trigger event.
Attribution
Attribution refers to how “credit” is assigned to traffic sources for various conversion actions. For example, let’s say you have a B2B company and the primary goal of your website is to generate leads through a contact form.
You have a prospect who fills out the contact form after his third visit to the site. Does the traffic source of the last visit get 100% credit? That’s called last click attribution.
Or, do you want Google Analytics to evaluate data for your specific site so it can attribute partial credit to the visits from multiple visits? That’s called data-driven attribution. You can decide in “Attribution settings” in the “Data display” settings of the GA4 admin panel.
BigQuery
One of the benefits of GA4 is supposedly the free integration with Google BigQuery. In the days of Universal Analytics, this was only available with paid GA 360 accounts.
Using the BigQuery integration requires creating a Google Cloud account (that’s free) and a project for BigQuery (also free). Here’s how to set up the GA4 and BigQuery integration if you want to follow along in your own GA4 account.
Bounce Rate
Google Analytics 4 calculates bounce rate differently than in UA. In UA, the bounce rate is the percentage of single page sessions. In GA4, bounce rate is the inverse of something called the engagement rate or “engaged session” rate. An engaged session is any session that is 10 seconds or more, OR has two or more page views, OR has a conversion. Any session that doesn’t hit one of those criteria would increase the GA4 bounce rate.
A bounce is a visit to your website where your visitor likely didn’t find what they were looking for and left the site prior to converting. A low bounce rate can be representative of a site that offers a helpful user experience, while a higher bounce rate can be indicative of potential user experience issues.
Channel
Traffic comes to a website through various sources. This traffic can be analyzed in different ways (different “dimensions”). One such dimension is the channel level; it is the least granular way to measure your traffic acquisition in Google Analytics.
One example of a traffic channel is Organic Search. If you wanted to look at how the various search engines performed (Google vs. Bing vs. Bing vs. DuckDuckGo, etc), you’d need to analyze your traffic at a different level like Source or Source / Medium.
Conversion
A key action that you track directly related to how your website makes your business money or otherwise supports a key organizational goal. In Google Analytics 4 we can create conversions by marking certain events to be counted as conversions. This makes sense for the most important events that we track.
As of March 2024, Google has renamed conversions as “key events.” You can read that here.
Conversion Counting Method
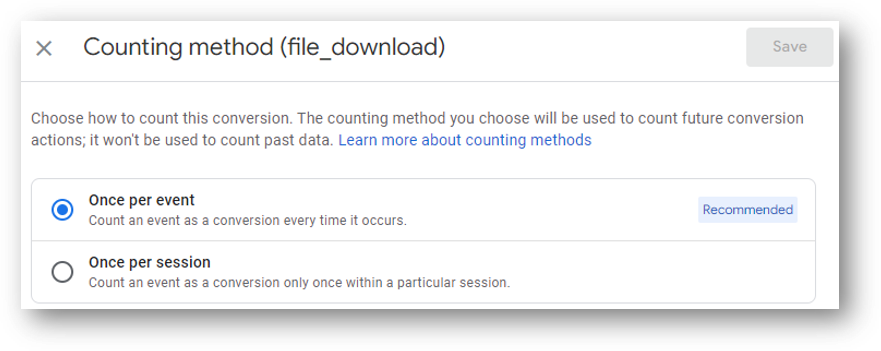
In Google Analytics 4 conversions can be counted in two different ways. They can either be counted “once per event” or “once per session” as you can see below.
Once per session is the way that conversions were counted in Universal Analytics. This method may be most helpful for situations where a meaningful conversion action really only takes place once in a single session. For example, a file download conversion might make sense to count only once per session (since it doesn’t matter much whether your visitor downloads the same file twice or once).
Once per event may be more helpful for conversions like purchases where you truly want to track a conversion every time the event occurs, even if it occurs more than once in a session.
Configuration Tag
The GA4 configuration tag had been the tag type to use when setting up GA4 through Google Tag Manager. It was the tracking code that has the unique “Measurement ID” that maps back your specific data stream.
However, beginning in fall 2023 this configuration tag type was removed. It was replaced by the new Google tag.
Consent Mode v2
Consent mode v2 is a mechanism designed to help respect visitor privacy choices made on cookie consent banners. Arguably it also limits potential legal liability for Google created by privacy legislation like the Digital Markets Act (DMA) in Europe.
When consent mode is enabled, Google tags will receive visitor privacy choices and then adjust how they fire and collect data.
Custom Dimension
A “dimension” is an attribute of your data in Google Analytics. These dimensions can sometimes help to provide additional context to events. A “custom dimension” is one such attribute that Google Analytics 4 does not track on its own. Instead, we need to be able to do some additional work to be able to see this data. Custom dimensions are especially important in the context of “events” and “event parameters.”
This guide explains how to use custom dimensions.
Data Retention
Certain reports in GA4 will only track a limited amount of data. The advanced reporting feature called “Explorations” (see below) will only record 2 months worth of data by default. You can change this to 14 months in the admin settings using the Data Retention settings.
If you haven’t already done so, this 10 step implementation guide to GA4 could be worth a read.
Data Stream
Data streams are new in GA4 compared to UA. It refers to a flow of data from your website or app to GA4. Data streams can be 1 of 3 types: Web (websites), Android (Android apps), or iOS (iOS apps).
The GA4 tracking code (the “configuration tag”) is found within the Data Stream.
Dimensions and Metrics
Your Google Analytics 4 data is presented in terms of dimensions and metrics.
A dimension is an attribute of your data. A metric is the quantifiable part of your data. For example, you might be looking at the total number of Sessions (visits) broken down by Country. In this situation the dimension would be Country and the Metric would be count of Sessions.
Engagement Rate
Engagement rate is a GA4 metric that shows the ratio of your engaged sessions to your total sessions. An engaged session is one in which one of the following 3 things takes place:
- Lasts for 10 seconds or more
- Includes 2 or more page views
- Has a conversion event
Fun fact: it’s possible to customize your engaged session timer (increasing for 10 seconds, should you so choose) in your GA4 setup.
Explorations
Explorations are an advanced reporting feature that is available in GA4.
It is a new term compared to Universal Analytics. Explorations can be used from pre-existing templates or they can be created completely from scratch by selecting your own dimensions, metrics, and segments.
Here’s an example of how to use GA4 Explorations.
Event
A specific web interaction is tracked as an “event” in GA4.
There are four different types of events in GA4. You can read about them below. Although for practical purposes we can consider them in two categories: events that GA4 tracks by default and events that we need to configure ourselves for tracking.
Automatically Collected Events
Automatically collected events are collected automatically by GA4. How’s that for profound? The first_visit, session_start, and user_engagement events are the most important automatically collected events to know. Unlike enhanced measurement events (below), you can’t disable automatically collected events.
Here’s what Google says in their support article about these events.
Enhanced Measurement Events
Enhanced measurement events are an area of real strength for GA4 relative to UA. Most of these events were things that could not be tracked in UA without custom work requiring the help of Google Tag Manager. In GA4, however, these events are collected by default. Unlike automatically collected events, you can decide to toggle some or all of these events “off” if you want to.
Some examples of enhanced measurements are the ‘scroll’ event (fires at 90% scroll depth), the click event (fires on outbound link clicks), and the file_download event (fires when an embedded file is downloaded). Here’s the full list of enhanced measurement events and event names from Google.
One important thing to note: there are limitations to some enhanced measurement events. For example, on this website we’ve turned off the ‘scroll’ enhanced measurement event and replaced it with a custom scroll tracking event that will record data at multiple depths instead of just 90%.
Recommended Events
Unlike automatically collected events and enhanced measurement events, these events will not be tracked by Google Analytics by default. We’ll need to do the work ourselves to track them.
Google gives us a little bit of help for Recommended events by providing a recommended event name to use. Google will also recommend names of event parameters for us to use with those events. But all of the setup work to create the event falls fully on the analyst.
Here is Google’s documentation on Recommended events and parameters.
Custom Events
Custom events are differentiated from Recommended events by the fact that Google doesn’t provide a recommended event name or recommended event parameters for the event.
Custom events are similar to Recommended events in that Google Analytics won’t collect them automatically for us. There are two primary ways to create custom events. You can create some custom events through the GA4 interface. Other custom events need to created with the help of Google Tag Manager.
If you already know all about Tag Manager, there are a number of custom event tutorials on the Root and Branch YouTube channel. Here’s how to set up a custom event for button click tracking and here’s how to install GTM in 4 minutes. If you’re not yet comfortable with GTM, this guide to understanding tags and triggers may be worth a read.
Event Parameters
Parameters provide additional context to events. For example, you might track the number of internal link clicks with an event named internal_link_click. Do you want to see the destination URLs of the links that were clicked? Do you want to see the text of the links that were clicked? This additional context would be provided by event parameters. Compared to UA, event parameters play an even more prominent role in GA4.
Google Signals
Google Signals is a Google product that can be associated with GA4. Signals are additional data that comes from users who are signed in and have consented to Ads Personalization. This additional data can be used for cross device remarketing and tracking.
Here’s what Google says in this support article:
Google signals are session data from sites and apps that Google associates with users who have signed in to their Google accounts, and who have turned on Ads Personalization. This association of data with these signed-in users is used to enable cross-device reporting, cross-device remarketing, and cross-device conversion export to Google Ads.
Google Analytics Help
Google Tag Manager
GA4 functions best when used in conjunction with Google Tag Manager. Tag Manager can quickly install the GA4 configuration tag. Tag Manager can also create custom GA4 event tags for things like button click tracking and custom scroll depth tracking.
For more reading check out this high level take on Google Analytics vs. Tag Manager.
Page Referrer
The page referrer dimension shows the previous page the visitor was on before taking a specific action in Google Analytics.
Sessions and Users
A session is another name for a visit in Google Analytics. When a visitor arrives on your site, GA4 fires the session_start event and begins collecting data about the session (the visit).
A user is another name for a visitor in Google Analytics. The same user may be responsible for multiple sessions over a period of time on a website. Google Analytics categorizes users into different groups, including New Users, Total Users, Active Users, and Returning Users. This GA4 users guide has all the information if you want to learn more.
Standard Reports
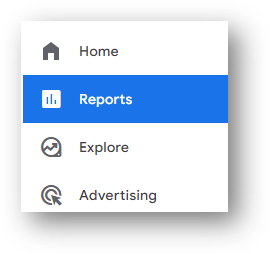
GA4 has multiple places for reporting functions. Earlier in this list of key definitions we covered Explorations, the advanced reporting features. There are also “Standard reports.” Standard reports live within the “Reports” section of the GA4 interface. You can see that below. For a full review, this guide to standard reports has the details.
Thresholding
Does your GA4 property seem to be missing data? If so, thresholding may be the culprit. Google Analytics applies thresholds when it believes the identity of individual users may be at stake. Here is what Google says in their support article:
Data thresholds are applied to prevent anyone viewing a report or exploration from inferring the identity of individual users based on demographics, interests, or other signals present in the data.
Google Analytics Support
Universal Analytics
The version of Google Analytics that was widespread from its launch in 2007 until it’s sunset on July 1, 2023. Universal Analytics (also called UA or GA3) was replaced by the new Google Analytics 4 property type. For more info on what Google Analytics used to be like, check out this comparison of GA4 vs. UA.
User Engagement Event
The user_engagement event is one of the automatically collected events in GA4. This is the name of the event that fires when a sessions moves to being counted as an engaged session.
This is a particularly important rate because it directly influences engagement rate and (the inverse metric) bounce rate. Furthermore, it influences how engagement time is measured in GA4 via the engagement_time_msec parameter.
View
In Universal Analytics many of us were familiar with the account structure of Account -> Property -> View. In GA4, there are no more Views. There is instead the “Data Stream” in the GA4 account hierarchy, although this doesn’t perform the same function as a View in UA.
It is possible, however, to use report filters to replicate some of the same View functionality in GA4.




Trackbacks & Pingbacks
[…] your visitors across both app and web. Data stream is one of the terms on this review of important GA4 definitions that help to make sense of the new property […]
Leave a Reply
Want to join the discussion?Feel free to contribute!