
GA4 Views: Views Metric and Creating a Filtered “View” (2025 Update)
Updated: 1/27/25 You can can use report filters to replicate much of the same functionality that you liked about “views” from the days of Universal Analytics. Easy breezy. And if you’re wondering about the metric called “Views” the answer is even faster. Let’s get to it.
We’ll cover 4 things in this blog post.
- What is the “Views” metric in GA4?
- What’s up with Views in Google Analytics 4? (and data streams too)
- How can you create your own Views in GA4 using filters? (Or at least get close)
- How to save your new filtered report?
Let’s dive right in.
Where is the “Views” Metric in Google Analytics 4?
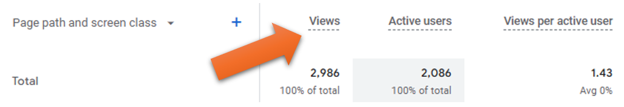
The Views metric represents “pageviews” in GA4. The screenshot below from the “Pages and Screens” standard report tells us that there 2,986 pageviews during the time period in question. We also see there were 2,086 active users, which means each user viewed an average of 1.43 pages.
GA4 simply does not have Views. This is one of the many differences between GA4 and UA and it’s because the account structure is entirely different.
If you look in the “Events” report, you’ll see the same number of “Views” as the event count for the page_view event. Check it out below, with the same 2,986 event count for the page_view event.
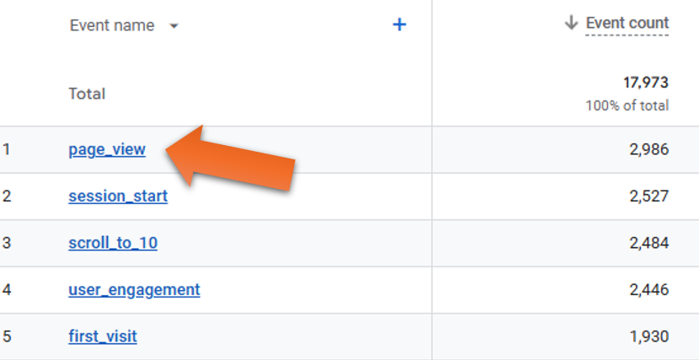
If that’s what you’re here for you, you’re all done. Nothing else to do, except perhaps learn about a couple of the other events shown in the screenshot above. The session_start event and the user_engagement event are personal favorites for understanding how GA4 works.
If you’re here wondering about Views in the context of the GA4 account structure, read on below!
U
Where Are “Views” in Google Analytics 4?
GA4 simply does not have Views. This is one of the many differences between GA4 and UA and it’s because the account structure is entirely different.
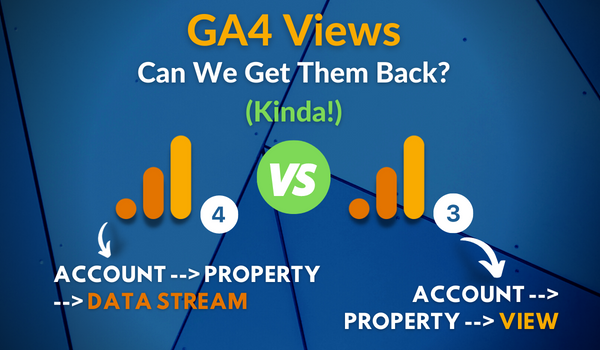
The Universal Analytics Account Structure
In Universal Analytics, the structure included 3 elements: Account –> Property –> View. The Account level lines up with an overall organization. Each distinct web property (like a website or an app) had its own unique tracking code and existed at the Property level of the structure. And Views were where you actually looked at your data and reports.
This is not the way things are set up in GA4.
The Google Analytics 4 (GA4) Account Structure
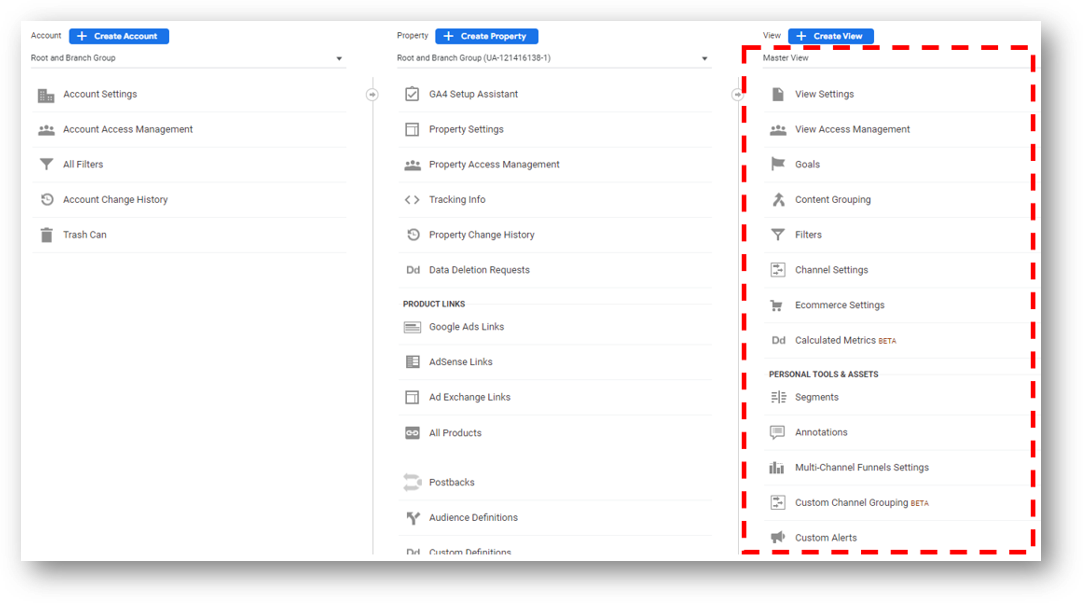
The GA4 account structure only has two levels: Account –> Property. Like with UA, the Account level lines up with an overall organization. Unlike UA, each distinct web property (like a website or an app) lives in the same Property level of the structure. This allows app and website data to be combined in a single property and can create a unified view of online visitors across both a website and an app. In fact, GA4 was previously called the “App + Web Property” when it was first released in beta.
When you look at the Admin section of GA4, you’ll see settings for only the Account and the Property level of the hierarchy. One of the available options in the Property settings is Data Streams. Check the 4th one down from the top. When a website and an app exist together in the same property, each will have their own Data Stream that flows into the property.
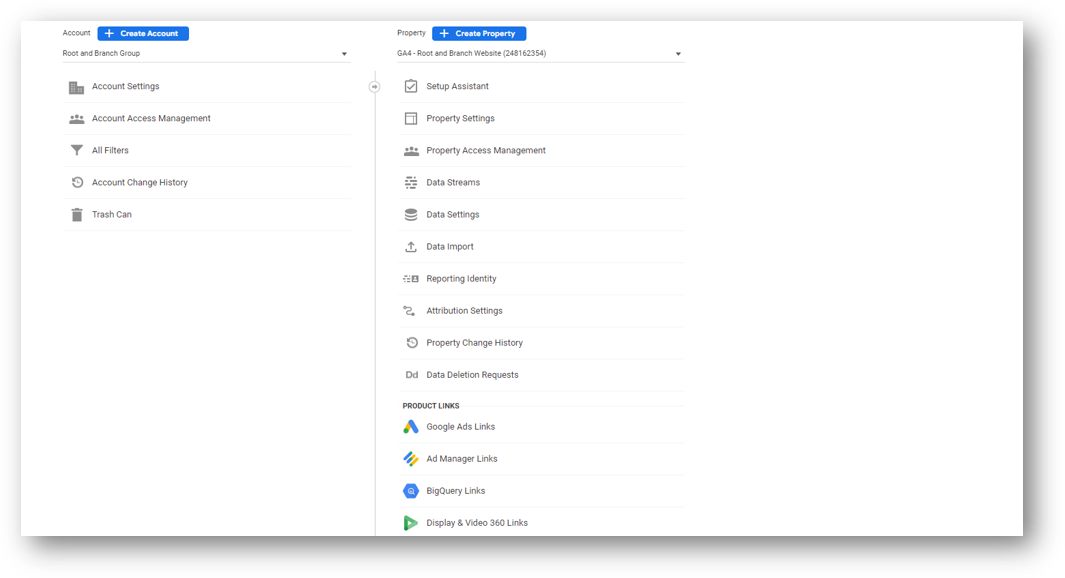
The Data stream isn’t technically part of the GA4 account hierarchy. However, it’s still important to understand how Data streams work.
What is a Data Stream in GA4?
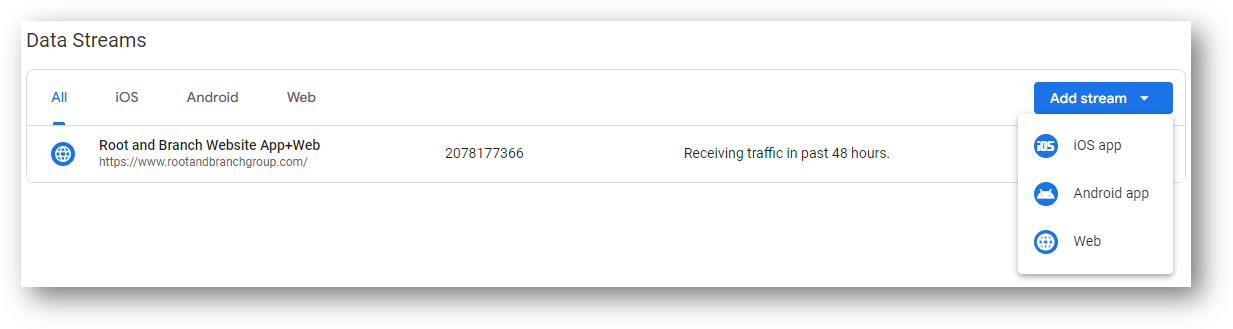
A data stream is a source of data from your website or mobile app to Google Analytics 4. There are 3 types of data streams available in GA4. You can have a web stream. This is the only type of stream in the Root and Branch GA4 property because there is no app. The other two types of streams are an iOS app stream and an Android app stream.
Check out the 3 options below on the right side of the image. You can also read the Google support article here if you’re interested.
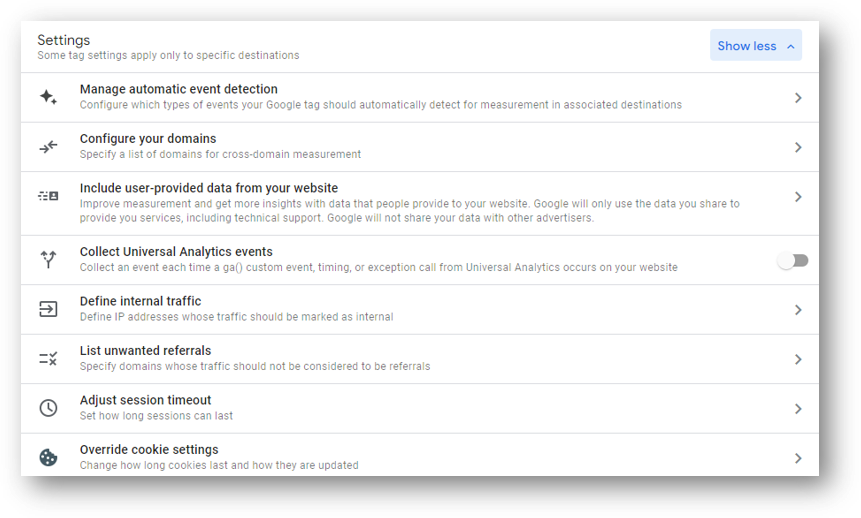
Each data stream has settings that help to control the specific data is displayed in the GA4 Property. You can see some of those settings below. However, almost none of these settings can help us to replicate the View functionality that we had in UA.
So if we can’t use our Data Stream settings to replicate View functionality, how can we create View-like functionality in GA4? For that we need to use Filters and the standard GA4 reports.
How to Create a “View” (kind of) in GA4
To create a close approximation to Views, you can use GA4 filters. Here’s how to do it.
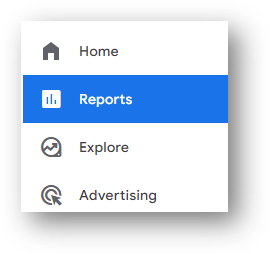
First, click into the “Reports” section of GA4.
From there, you’ll need to have a specific plan for the “View” (filtered report) that you want to create. In our case, let’s say we want to create a version of the Events report that is limited only to visitors from the United States.
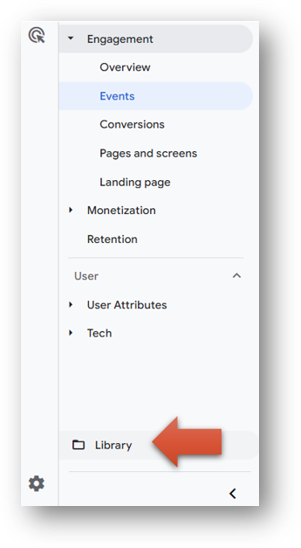
So, look in your “Engagement” reporting area and click into the “Events” report.
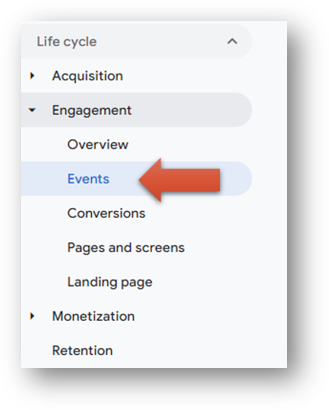
There are now two options for filtering your report to approximate a View. You can use the “Add filter” function (yellow arrow) to temporarily filter your report. Or, you make your filter permanent by creating a new custom report (red arrow).
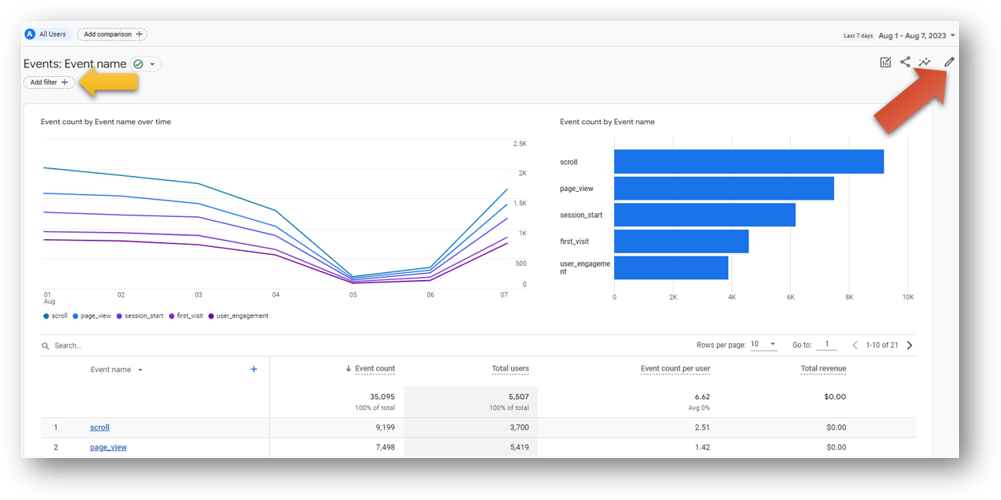
We’re going to make a new custom filtered report so click the pencil icon by the red arrow. Let’s finish up the process below.
Using GA4 Filters as Views
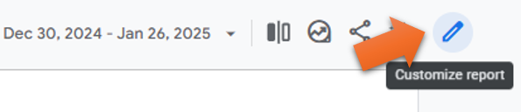
To create your filtered report, you should have clicked on the pencil icon in the top right of the screen to “Customize report.”
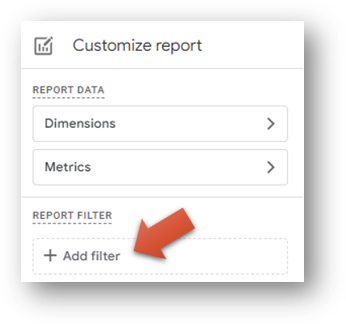
Now, click “Add filter” on the right side of the screen.
Click “Select dimension” to select the dimension you want to filter on.
Note: See that this filter is set to “Include” by default. If you click the drop down arrow to the right of “Include” you’ll also see the option to build your filter based on Excluding specific dimensions.

Since we want to create a filtered report that will only show Events in the United States, we’re going to stay with the “Include” condition.
Search for the “Country” dimension and select “United States”. Just like below. Then, click “OK”.
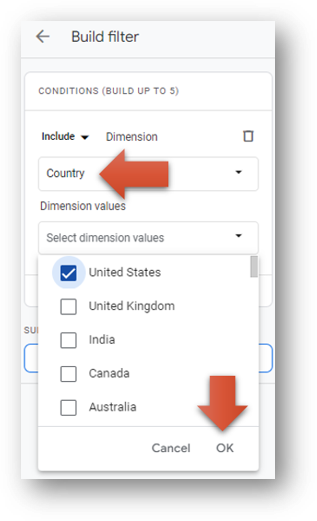
Then, hit the blue “Apply” button in the bottom right of your screen.
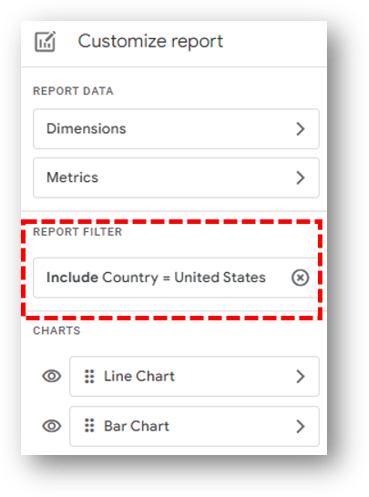
You’ll see your report re-build to only include the data that you wanted to see in view.
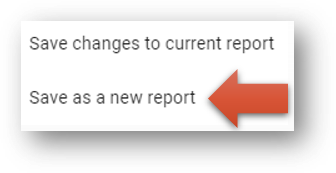
Now, it’s time to save your report so you can retain permanent access to it within your list of standard reports.
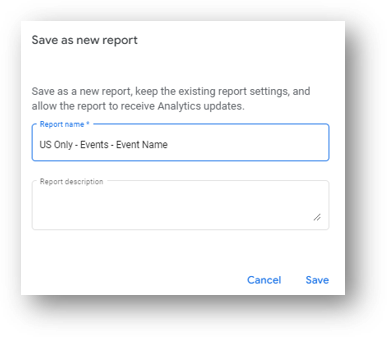
How to Save Your Filtered Report
Now, click the blue button to “Save” the report.
Choose option to save
Now it’s time to give your report a name. You can see our name below. Then, click “Save”.
Saving it as a new report will make it available in your Library of available GA4 reports. Let’s go to Library so we can add your new report to a “Collection”
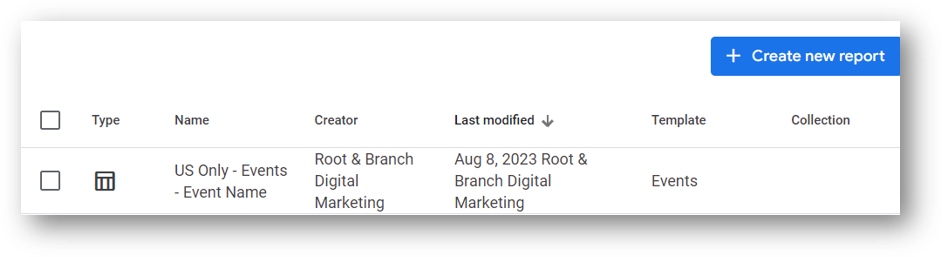
You should see your newly created report at the top of your listed reports. This is what you’ll be adding to your reporting collection.
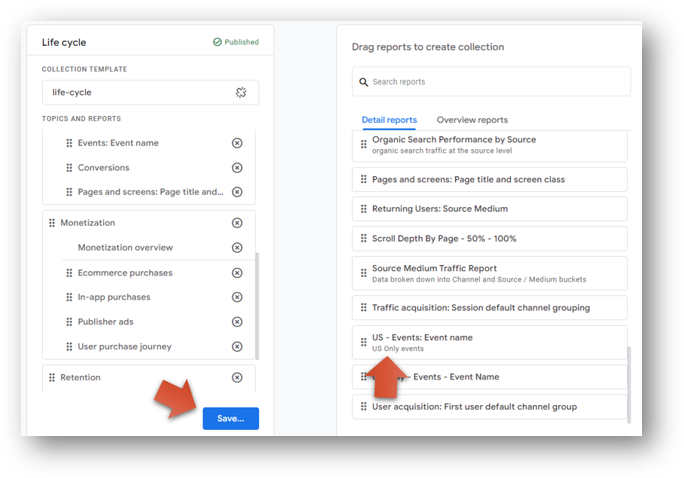
Instead of clicking on your new report, click into your “Life cycle” Collection above the list of reports.
Click “Edit collection” as below.
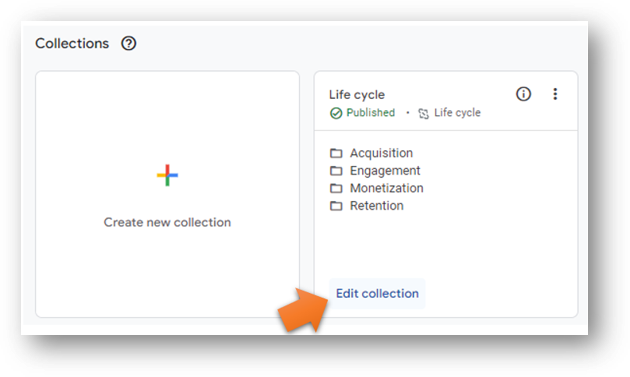
Find your new report on the right hand side (see red arrow on right). Then, drag it over to the report on the left to the place where you’d like to show up in your list of reports.. You can re-order other reports as well.
Then, click “Save”.
You’ll now have it available for easy reference.
Other Reporting Resources in GA4
Reporting in GA4 is quite different from UA. Not only are Views a thing of the past in GA4, but many other elements are either completely new or quite different.
Here are several resources that should make things easier for you.
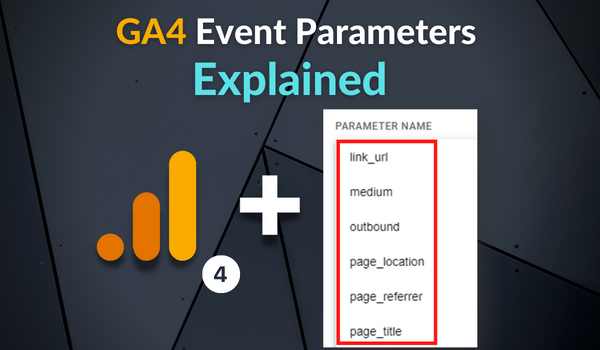
Event Parameters in GA4
A “parameter” is a piece of data that adds additional context to a web interaction (an “event”). For example, an internal link click might be called internal_link_click event. The event will register and record data each time the event occurs. But if you want to see additional information like the specific link that was clicked or the text of the link that was clicked, you’re talking about event parameters.
Event parameters are handled very differently in GA4 than in UA. And any comprehensive understanding of reporting requires understanding GA4 event parameters.
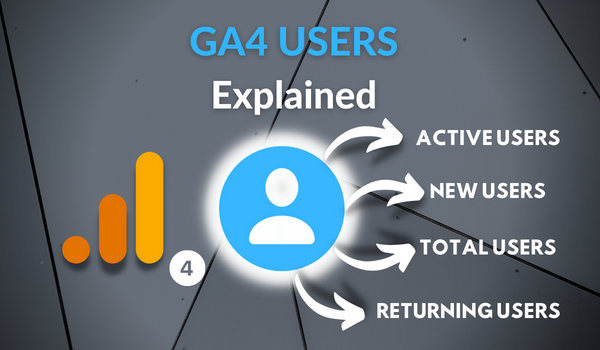
GA4 Users
Did you know that some GA4 reports show “Active users” by default while others show “Total users”? And how can you find your new vs. returning users? This updated guide to GA4 users has the info.
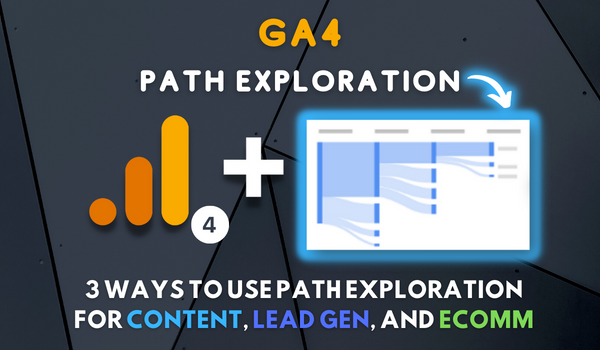
Path Analysis in GA4
The Path Exploration report in GA4 is one of the new reports that is available within the “Explore” section of GA4. Path Exploration compares to the Behavior Flow report in UA and represents a big upgrade for GA4. Unlike in UA, the Path Exploration report works based on either a starting point OR an ending point. Here’s how to use it.
Campaign Reporting With UTMs in GA4
Do you know how to access your UTM tagged campaign traffic in GA4? This is necessary to track how your marketing campaigns are performing. It’s also useful for measuring traffic mediums (like email) that Google Analytics can’t classify on its own. Check out the guide to Google Analytics 4 UTM parameters here.
Wrapping Up
A
Root & Branch believes that data can play an important part in making better decisions. And that digital analytics is more than mere data collection. What do you think? Feel free to add a comment or get in touch to share any feedback.
G


")

")


Can we grant access to specific e-mails in data streams?
Hi Georgia, are you asking if you can grant access to a specific report to people who already have access to the data stream?
Or, how to grant access to new users to your GA4 property? If the latter, you can go to the Admin section and click on “Property Access Management” to add a new email address / user. But if you have multiple data streams in your property (say an app and a website), I’m not aware of a way to grant access to only one of those data streams and not the other.
I don’t have the same options you show in my GA4. For instance, there is no Scroll by Depth or US Events under the Events report, only Conversions, Pages and screens, and Landing Page. When I do click on the Events report, there is no pencil icon to customize it. Otherwise, what you describe is exactly what I would like to do, to be able to save a filtered report to replace my old Views.
Hi Rachel,
If you don’t have that pencil icon it likely means your access level in Google Analytics needs to be upgraded. Customizing reports requires a high level of access than (I believe) you were granted.
This ~7 minute YouTube video shows 6 tips for customizing / filtering reports. That is what I had used to create the reports you mention seeing on my screen. Hope it’s helpful: https://youtu.be/X6tvL7WVoyM
Best of luck to you.
When I add a Hostname Comparison to an Acquisition Overview report and hit Customize and Save As a New Report, it doesn’t look like the comparison stays attached to it. When I add it to a Collection, the report just looks like the standard Acquisition Overview. Can you confirm that Comparison should remain attached when you customize and save a report?
I’m really trying to make GA4 more usable for my end-users who are used to having domain-specific reporting views.
Hi Caitlin, to the best of my understanding ‘Comparisons’ can’t be saved in custom reports. That certainly seems like a miss, doesn’t it? Hopefully, something Google will address soon as it continues to make updates to the platform.
Best of luck.
Hey Zack, have GA4 updated the report filters options and how it’s designed? I can’t see the include/exlcude option just above the Filter itself. Are there any other possible reasons? Please help
Hi there, AK. Yes, Google made some changes to the admin panel in late October / early November 2023.
You should still be able to see include / exclude options though. Go into “Data filters” in left-hand navigation under Property settings (within Data collection and modification). From there, you should be able to use a drop down to select whether your Internal traffic filer and Developer traffic filter are to set to Exclude or Include only.
How do I filter out internal traffic using my IP address since there is no ‘views’ in GA4
Here you go: https://support.google.com/analytics/answer/10104470?hl=en