
GA4 Engagement Rate Explained
Updated: 11/8/23 The GA4 engagement rate metric is a helpful way to measure your site’s traffic quality. But what is it, exactly?
To understand engagement rate, we also need to understand what makes an engaged session and how it’s related to bounce rate. The good news is we can do all these things. So, let’s go do it!
Engagement rate is a completely new metric in GA4. This guide has all the info you need to understand, use, and improve your engagement rate. Here is what we’ll cover.
Table of Contents
- What is Engagement Rate in GA4
- What’s an Engaged Session
- What’s a Good GA4 Engagement Rate?
- How Does Bounce Rate Relate to Engagement Rate?
- How Can You Customize Engagement Rate Calculation?
- How to Use Engagement Rate
- How to Improve Engagement Rate
- Other Site Engagement Metrics
If you’re not in the mood for reading, you could just refill your coffee and watch this video version instead.
What is Engagement Rate in GA4?
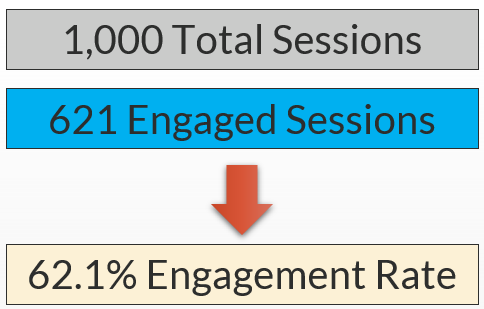
The GA4 engagement rate is the percentage of engaged sessions on your website. You can think of it as a measure of your site’s traffic quality.
If you have 1,000 total sessions on your site and 621 count as “engaged sessions” you can see the engagement rate calculation is straightforward.
That’s some simple math but it leaves one important question…
What counts as an engaged session?
What’s an Engaged Session in GA4?
An engaged session is a session where the GA4 user_engagement event fires. It hits one of these three criteria:
- Lasts 10 seconds or more
- Includes 2 or more pageviews
- Includes a conversion
You can read Google’s own support article here if you’d like further confirmation.
So in our example, those 621 “engaged sessions” each qualified through at least one of these criteria. The resulting 62.1% engagement rate provides an objective measure for comparing our site to itself over time and also for competitive comparisons.
What’s a Good GA4 Engagement Rate?
According to a review that Orbit Media did of their client websites, the average GA4 engagement rate was 55%. According to firstpageseo.com, a good engagement rate for a B2B site is 63% and 71% for a B2C site.
It’s still early days in benchmarking but these are helpful guardrails for evaluating our own site performance.
The Connection Between Bounce Rate and Engagement Rate
In GA4, the bounce rate metric is simply the inverse of engagement rate. In other words, a GA4 “bounce” is simply a session that is not engaged. It is a session that is low quality which doesn’t hit any of the three qualifying criteria we looked at for counting as engaged.
In our hypothetical 1,000 sessions yielding a 62.1% engagement rate, our bounce rate is 37.9%. Here’s the math works.
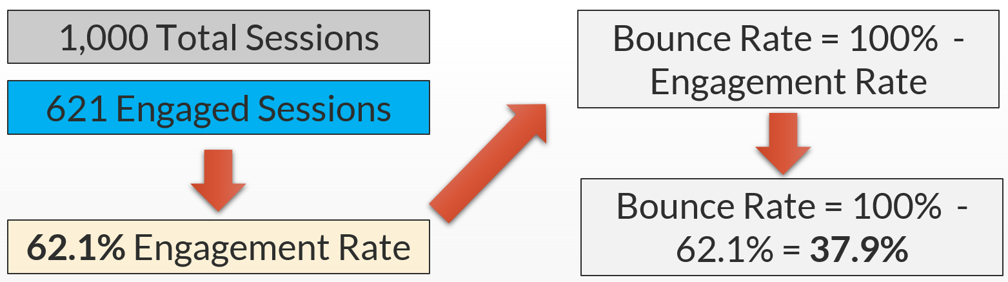
Is the engagement rate had been 55%, the bounce rate must necessarily be 45%. And so on and so forth. For this season, you certainly might choose to add bounce rate to your GA4 reports but it’s likely extraneous information if you’re already looking at engagement rate.
Before we talk about using engagement rate, we should cover a little known capability. Did you know you can customize your engagement rate?
It’s true! It’s one of the important decisions to make when you configure your GA4 property. Let’s review the process for doing that as you consider whether it might make sense for your property.
Customize Engagement Rate By Adjusting Timer for Engaged Sessions
Before we review the process, a quick disclaimer: You should not make any changes here without having a specific reason to do so for your site. You should also review with all internal stakeholders first.
With that out of the way, here’s how to customize your own property.
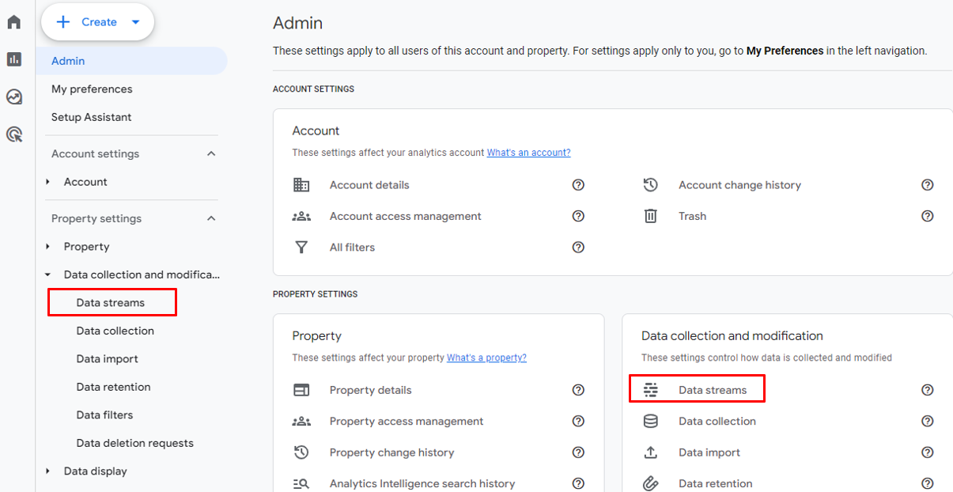
First, hit the gear icon in the bottom left of your screen to access your admin panel.

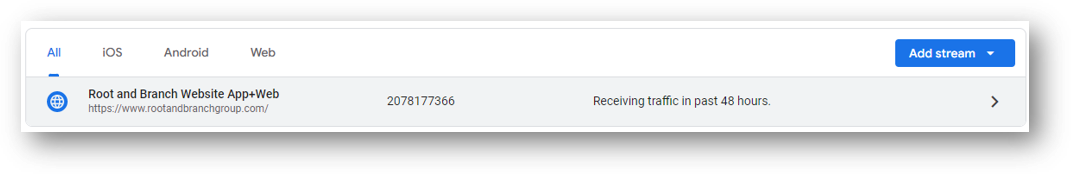
In the property settings under “Data collection and modification” click into “Data Streams.” You can find Data Streams in two places, as shown below.
Now, choose your data stream. Just click anywhere in that bad boy.
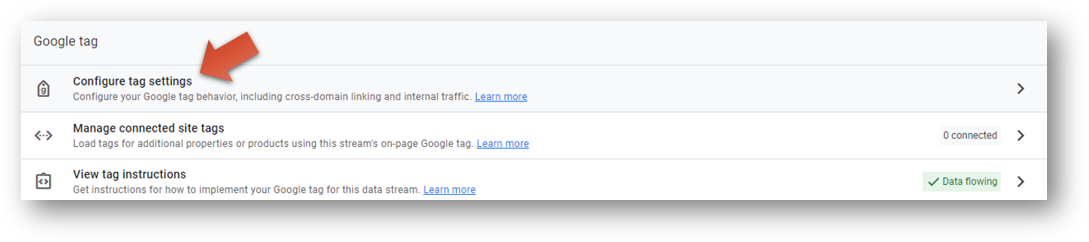
Scroll down and click Configure tag settings as you can see below.
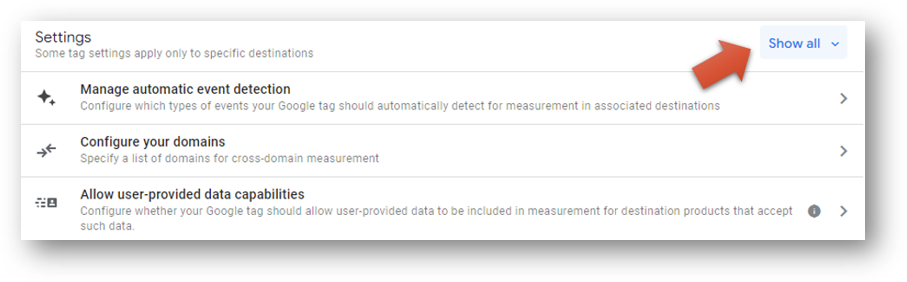
Expand to show all tag settings.
Now, click into Adjust session timeout. We can also change our timer for engaged sessions here.
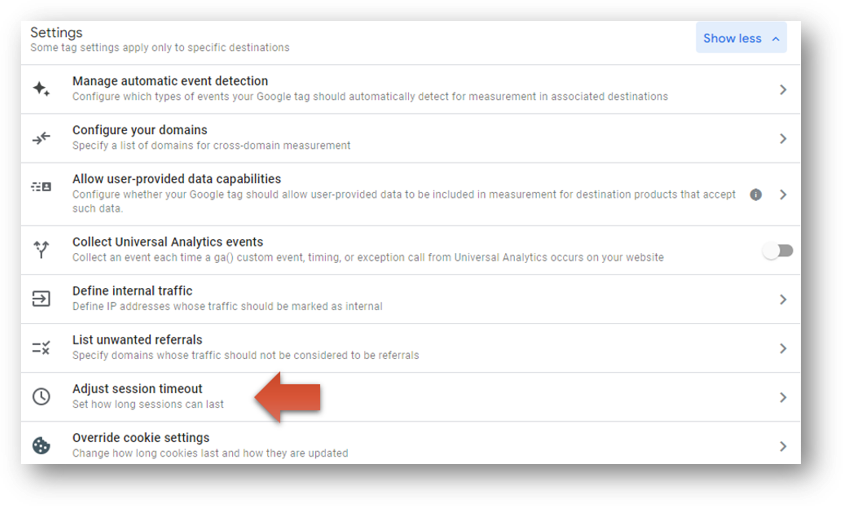
If you want to change the timer for counting an engaged session, you can do so here. You can make any selection you like in increments of 10 seconds up to a maximum of 60 seconds.
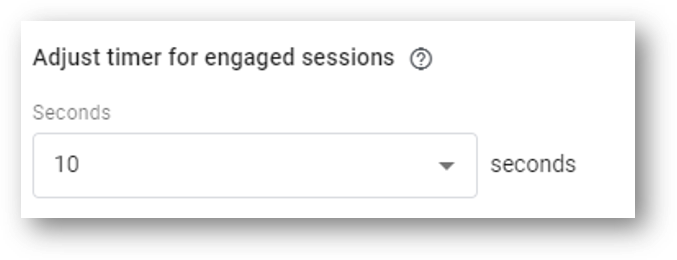
Be prepared for this to have a meaningful impact on your engagement rate. Your site almost certainly gets far fewer sessions of 50 or 60 seconds in length than it does of sessions that are only 10 seconds. With that said, this may be a wise decision depending on your specific goals for your site and your measurement plan.
After all, there’s not much use in looking at engagement rate if you’re not going to use it to understand – and hopefully improve – your website’s performance.
How to Use Engagement Rate
One of the best places to use engagement rate is to evaluate your traffic channels.
Using Engagement Rate to Evaluate Traffic Quality
You can do this in your Traffic Acquisition report (Reports -> Acquisition -> Traffic Acquisition) where you can see your users, sessions, and engaged sessions displayed next to each other. As we already know, it’s the relationship between our total sessions and our number of engaged sessions (in the red box) that yields our engagement rate.
At the far right of the table below we see an overall engagement rate of 75.59% for this particular site. If we believe our general benchmarks, we know this site is getting more than its fair share of quality traffic at this time. We can dig a little further and see that the high site engagement rate is driven by the engagement rate in Organic Search. Check out that sweet 77.47% engagement rate next to the green arrow for Organic Search. On the other end of the spectrum, Direct traffic is showing only a 56.92% engagement rate next to the yellow arrow.
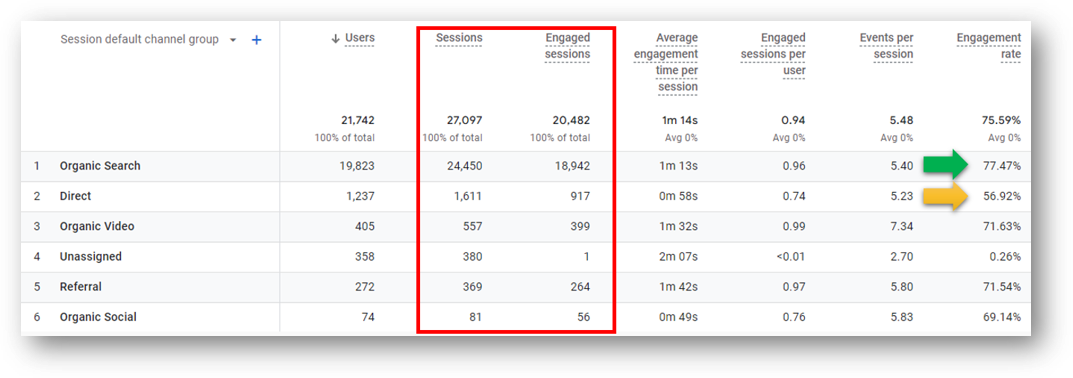
One way that this site could improve its overall traffic quality is simply to get more organic search traffic. If we wanted to dig deeper, we could look at the traffic at the Source / Medium level instead of the channel level (in other words google / organic and bing / organic and duckduckgo / organic instead of just Organic Search).
We could also look at what landing pages are featuring in the Direct traffic. the Organic traffic to see if there might be an opportunity to improve something. And that page level analysis is another use for the engagement rate metric.
Using Engagement Rate to Measure Content Quality
That’s right, we can use engagement rate to measure content quality of individual pages. The best standard reports for this are the Pages and screens report and the Landing page report.
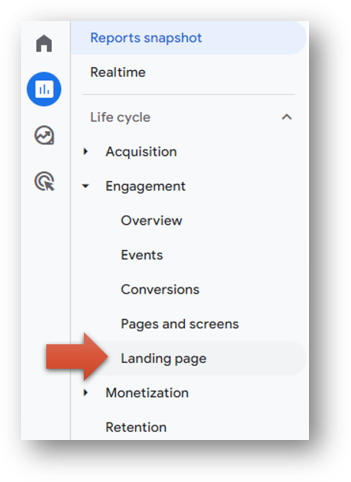
Let’s use the Landing page report (Reports -> Engagement -> Landing page). Here is how you get there:
The table below has data from a different GA4 property showing the top 7 landing pages. If we look in the top right of the screen, we see the overall engagement rate for this site is 53.65%. But we can also see there is a large variance between the rates on some of the top landing pages. The page with the green arrow has a solid 61.13% engagement rate while the yellow arrow identifies a page with a far lower rate of 50.36%.
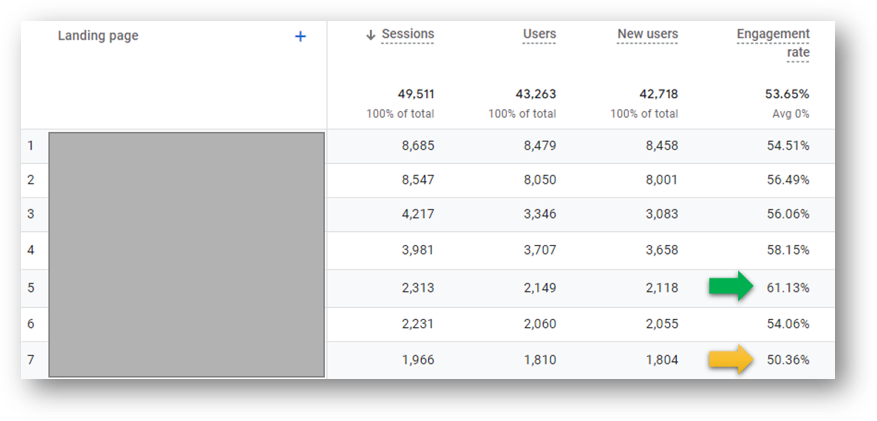
This particular content team might want to look at the page construction of the higher performing page and contrast it with the lower performing page. There are likely patterns of engaging page construction and writing style that can be borrowed from the higher performer.
Testing some of these hypotheses will – over time – lead to more engaging content, a higher engagement rate, and better overall site performance.
Your own landing page report may not have engagement rate already shown. If that sounds like your situation, here’s how you can customize your own report so it looks like the one above.
Customize Landing Page Report
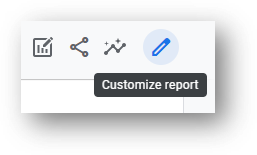
To start, hit the pencil icon in the top right of the report to.
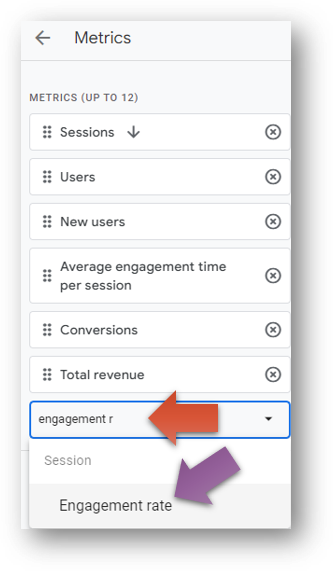
You’ll see dimensions and metrics available on the right side of the screen. In our case, we want to add a new metric. Hit “add metric” at the bottom of the metrics and begin typing “engagement rate”.
You can see this at the red arrow below. Google Analytics will auto suggest the Engagement rate metric which you can see next to the purple arrow. Click it to add this metric!
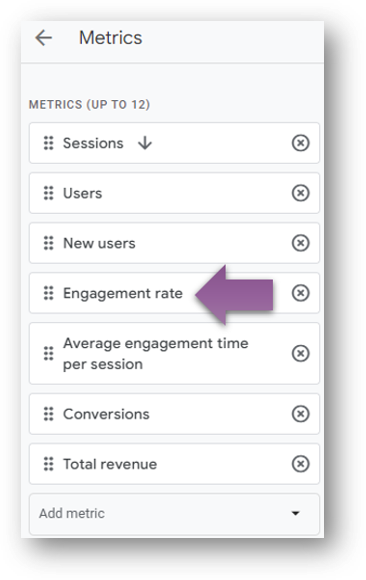
Then, you can move the metric to change the order in which it shows in your data table. In order for the engagement rate metric to be the 4th column of metrics in your report, click and drag it to 4th in your list of metrics as you see below.
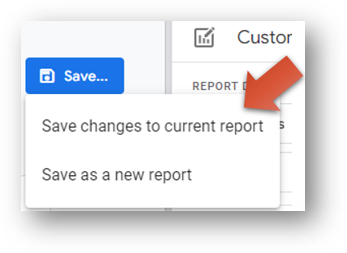
Click the blue “apply” button to make your change.
Finally, click the blue “Save” button to save the report. In our case, we’ll modify the existing report rather than create an entirely new one so we’ll select “Save changes to current report”.
Now, we have a helpful report that will help us keep tabs on our content quality with an eye towards fostering the most engaging content we can create.
How to Improve Engagement Rate?
We looked at two ways to improve engagement rate.
The first is to be mindful of our mix of traffic channels and the relative engagement rates of each. If we focus our acquisition efforts on prioritizing growth in channels with high engagement rates, our overall site engagement rate will rise.
The second way to improve engagement rate is to analyze your top pages and compare your engagement rates. With this page level analysis, we’ll be able to uncover patterns and trends in our pages with the best engagement rates and contrast them to what patterns we see in our lowest performing pages.
- Perhaps the poor performers are loading slowly. Do your images have huge file sizes that are bogging down the site?
- Maybe you neglected to include images at all. Are your visitors are getting overwhelmed by a “wall of text”?
- Perhaps there are long and unwieldly sentences. Are you losing people?
There are a number of possible issues that your analysis can uncover. Whatever the root issues, the poor performers can be updated and improved to boost engagement rates. And you can carry forward the lessons you learn into future pieces of content your create.
You can also continue to improve your engagement rate by being mindful of other relevant site engagement metrics in GA4.
Other Important Site Engagement Metrics in GA4
Engagement rate is an important measure of overall site engagement. Here are a few others that you’ll see in your GA4 reports.
GA4 User Engagement
An event-scoped metric that is automatically populated by GA4. This is a time-based metric that records how long visitors are actively engaged on your site.
Here is what Google says about user engagement:
When a user begins a new session, Google Analytics starts to record the amount of time in the session (in milliseconds). The amount of time is sent to Analytics when any of the following happen:
- The user moves the app screen to the background
- The user focuses away from your web page
- The user navigates away from the app screen or web page (e.g., the user closes the tab, window, or app; the user navigates to another screen or page)
- The site or app crashes
The amount of time is sent in an engagement_time_msec parameter and added to the next collected event.
This time component of the GA4 user engagement metric is the primary driver of the engagement rate discussions we’ve had here. If you were pulling data from the Google Analytics API, you’d see this event named userEngagementDuration. It is a key ingredient in a number of other important site important metrics.
Average Engagement Time Per Session
How it’s calculated: Total user engagement duration / total number of sessions.
Average Engagement Time Per Engaged Session
How it’s calculated: Total user engagement duration / total number of sessions.
Average Engagement Time Per Event
How it’s calculated: Total user engagement duration / total number of events
Average Engagement Time Per User
How it’s calculated. Total user engagement duration / number of active users.
Stay tuned for a future guide focused on user engagement and the user_engagement event.
Wrapping Up
If you’ve made it all the way to end, well, wow! Thank you for reading and thank you for engaging. I sincerely hope it’s been time well spent. For monthly updates when new blogs and YouTube tutorials are published, you might consider signing up for the R&B monthly newsletter.
Or feel free to drop me a line on LinkedIn if you have ideas for a future GA4 blog or want to say hello. If you have an idea to be a guest blog author, I’d be happy to hear what you’re thinking.
Looking for something else? Feel free to leave a note in the comments or on the Root and Branch YouTube channel at youtube.com/@rooted-digital.
About Root & Branch
You can learn more about Root & Branch here. Or hit the button below to check out YouTube for more digital marketing tips and training resources.


")
")


Thanks, Zack_Duncan, for providing detailed information about GA4 Engagement Rate.