
Microsoft Clarity Complete Tutorial: Setup, Analysis and More.
This comprehensive article will examine “Clarity,” a tool Microsoft offers. We will explore what this tool entails, its features, the process of setting it up, common misconceptions about Microsoft Clarity, how to create an account, how to utilise its data, integrate it with your marketing stacks, e-commerce measurement, id customisation, what and how to use custom tags.
You’ll also get a gift, a link to a free checklist designed to streamline the setup process and ensure that all crucial steps don’t get skipped, plus a spreadsheet to document your setups.
Clarity Table of Contents
- What is Microsoft Clarity?
- Why Should You Consider Clarity?
- What Are Some Of The Misconceptions About Microsoft Clarity?
- Hierarchy Within The Product
- Microsoft Clarity Data Retention
- Creating an Account
- How to Install Microsoft Clarity
- How To Install Microsoft Clarity Using Piwik Pro Tag Manager
- Tour of the Configuration Settings in Microsoft Clarity
- Understanding Clarity Reporting Interfaces
- Custom Tags in Microsoft Clarity
- Customisation of IDs
- E-commerce Tracking & Reporting With Microsoft Clarity
- Integrating Microsoft Clarity with Other Stacks
- Conclusion
What is Microsoft Clarity?
Often referred to as Clarity or Microsoft Clarity, it is a digital experience analytics tool that provides invaluable insights into user behaviour on your website and apps, which are becoming complex and challenging to understand.
Through session recordings, heatmaps, and various UX metrics such as rage, and dead clicks, Clarity enables you to comprehend the intricate nature of user interactions, identify potential frustrations within the user experience, and detect any funnel or JavaScript issues.
One aspect contributing to the widespread acceptance of Microsoft Clarity within the industry is its cost-effectiveness. It is free of charge, without any data sampling limitations or restrictions on data collection size. Additionally, the tool boasts robust privacy features.
Why Should You Consider Microsoft Clarity and Its Features?
There are several compelling reasons why Microsoft Clarity should be a valuable addition to your measurement and optimisation stacks:
- Cost: Microsoft Clarity is free, requiring only a Google, Microsoft, or Facebook account to use the product.
- Ease of Setup: While it is easy to set up, it is crucial to be thorough to avoid potential issues down the line.
- Extensive Data: Microsoft Clarity provides unlimited user recordings and heatmap data. However, reviewing the data retention section of this article is essential to understand what retention means.
- Valuable UX Insights: It offers essential UX data such as rage clicks, dead clicks, error clicks, last clicks, first clicks, quick backs, JavaScript errors, and excessive scrolling.
- E-commerce Tracking: Microsoft Clarity supports e-commerce tracking to some extent, which was covered in great detail further in the blog.
- Handling High Traffic: The tool is designed to handle data collection on websites with significant traffic, eliminating concerns about data sampling.
- Data Segmentation: It allows for creating customised data segments using a wide range of flexible filter options, which you can save for future analysis.
- Insightful Dashboard: Microsoft Clarity provides an intuitive dashboard that enables easy investigation and navigation to the most relevant data that has answers to your questions.
- Real-time Session Recordings: You can watch session recordings as data is collected, providing real-time insights.
- Integration Capabilities: It integrates with your existing analytics, marketing, and conversion rate optimisation stacks.
- Privacy Compliance: Microsoft Clarity is GDPR and CCPA-ready, with customisable privacy configurations to address privacy concerns.
- Collaborative Usage: The tool supports team collaboration even with large teams, as An unlimited number of team members can have access to a project.
- Unlimited Website Usage: There is no limit to the number of websites you can utilise Microsoft Clarity on.
- Minimal Impact on Performance: Although I personally haven’t conducted any performance test, thus far, there have been no noticeable issues with Microsoft Clarity affecting website performance.
- Internal Traffic Filtering: The tool offers internal traffic filtering based on IP address.
- User ID Tracking: Microsoft Clarity supports user ID tracking, allowing for customising specific identifiers within the tool.
- Event Tracking Feature: Microsoft Clarity also offers event tracking functionality for monitoring key user interactions, a concept explored in greater detail in this guide.
To understand what features exist in Microsoft Clarity, here is a list:
Heatmaps:
This feature provides valuable insights into user engagement on your web pages. The heat mapping report allows you to determine the areas that attract the most attention and reveals how far visitors scroll. Clarity offers three types of instant heatmaps:
- Scroll Maps: This shows the level of exposure a content or brand messaging receives on a web page.
- Click Maps: Provides insights into user click interactions on a web page. It reports different types of clicks, which we covered later in the blog.
- Area Maps: Displays total clicks within specific areas of a page.
Session Recordings:
This feature lets you watch video recordings of user sessions on your site. It offers high-definition playback, allowing you to observe and understand the user’s interaction with your website or app. In addition, you can control the playback speed with an option to label, favourite, and share recordings with your team members.
Insights:
The Clarity interface provides an intuitive dashboard with valuable data insights in various areas such as acquisition, UX optimisation, engagement, technology, e-commerce, funnels, and geography.
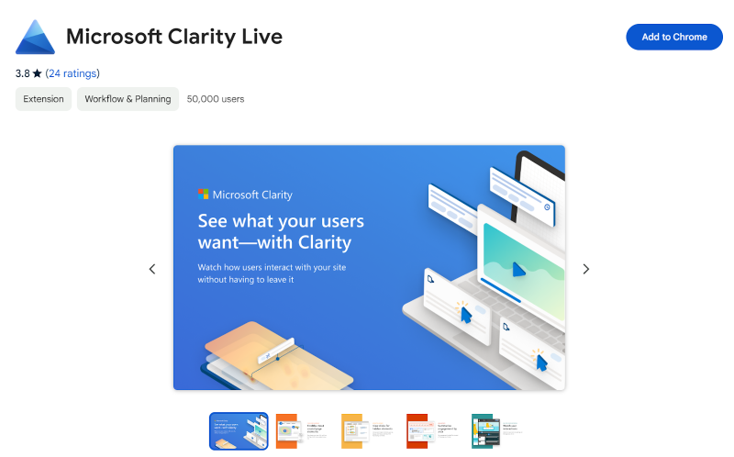
Clarity Extension:
It is a browser extension for Microsoft Edge and Chrome that enhances your experience with Clarity. It lets you instantly view heatmaps directly on your live site and access recent session recordings for any page you’re on, all within the extension.
AI Integration (CoPilot):
Also known as CoPilot, it leverages generative AI capabilities to enhance your data analysis experience. It offers an intuitive conversational interface powered by GPT, allowing you to understand your analytics data more efficiently. In addition, CoPilot helps with the following:
- Summarising session replays using easy-to-understand language.
- Summarise heatmaps data for quicker insights.
- It allows you to Interact with Clarity, like Chat GPT, where you can ask questions and receive concise summaries.
- If you have GA4 and Clarity integrated, the feature lets you query Clarity about your Google Analytics property data, enabling you to obtain answers and uncover trends.
Integration:
Microsoft Clarity allows seamless integration with other tools you’re familiar with. In addition, the integration capabilities will enable you to sync your existing stacks with Clarity, facilitating data sharing and uncovering new insights.
What Are Some Of The Misconceptions About Microsoft Clarity?
I have seen several misconceptions that people have about Microsoft Clarity, and I would like to address them:
- Microsoft Clarity is a replacement for your web analytics tool: This is not true. Instead, Microsoft Clarity will complement your existing web analytics tools like GA4, Piwik Pro, Mixpanel, etc., rather than replace them.
- The Native GA4 Integration is enough: While the native integration provides valuable insights, there are limitations when accessing the session recording playback URL in GA4 and BigQuery. I recommend complementing the native integration with a manual integration to overcome these limitations. (you’ll get to learn more further down the blog)
- You can’t identify users who have converted: This is false. With custom clarity, Microsoft Clarity has numerous possibilities for identifying users who have converted. You’ll learn how to do this later in this blog post.
- Microsoft Clarity doesn’t support e-commerce tracking: This is not entirely true. Microsoft Clarity supports e-commerce tracking to some extent, which I further covered in the e-commerce tracking section.
- Microsoft Clarity doesn’t support internal traffic filtering: This is incorrect. Like GA4 and other analytics stacks, Microsoft Clarity can filter internal traffic based on the user’s IP address.
- Microsoft exposes everything the user did on the website: While Microsoft Clarity shows user actions on the website, it provides privacy features such as “Masking.” This feature allows you to deploy strict or balanced masking modes and use the “mask by element” feature to redact any information you don’t want showing in session recording playback.
- Microsoft Clarity integrates only with GA4: This is false. On their integration page is a list of tools that Microsoft Clarity natively integrates with, and we discussed this in detail in the integration part of this article. You can manually integrate Microsoft Clarity with your CRM or other web and product analytics tools like Piwik Pro, Mixpanel, Amplitude, etc.
- Clarity doesn’t support event tracking: This is false. While the event tracking feature in Microsoft Clarity may not offer the same level of granularity as Google Analytics, you can still track user interactions through “Smart Events” in your Clarity project. Keep reading to learn more about how you can set this up in your project.
- Adding the Microsoft Clarity tracking script is sufficient for implementation: The value you derive from the tool depends on how thoroughly you implement it. This article will cover aspects of Clarity implementation that are often overlooked.
- You can’t customise user identifiers in Microsoft Clarity: On the contrary, Microsoft Clarity offers a high level of customisation. For example, you can identify website visitors using your store’s user or custom IDs.
Hierarchy Within The Product
Within Microsoft Clarity, there is a hierarchical structure that allows for organising and analysing data at different levels:
1. Account: An account is the top-level organisational entity in Microsoft Clarity. It represents ownership and access control for web analytics data. Unlike Google Analytics, Creating multiple accounts within a Microsoft Clarity user account is impossible.
2. Project: Within an account, you can create multiple projects. Each project represents a specific website or application you want to track and analyse. Therefore, each project has a unique tracking code implemented on the corresponding website or application.
Data Retention And All You Need To Know
Understanding data retention in Microsoft Clarity is crucial to avoid any unexpected issues. Clarity retains data, including heatmap data and labelled or favourited session recordings, for 13 months.
However, session recording data gets deleted after 30 days. However, suppose you want to reference a specific session recording after 30 days. In that case, you must label or mark it as a favourite to ensure it is retained for 13 months before it gets deleted.
Creating an Account
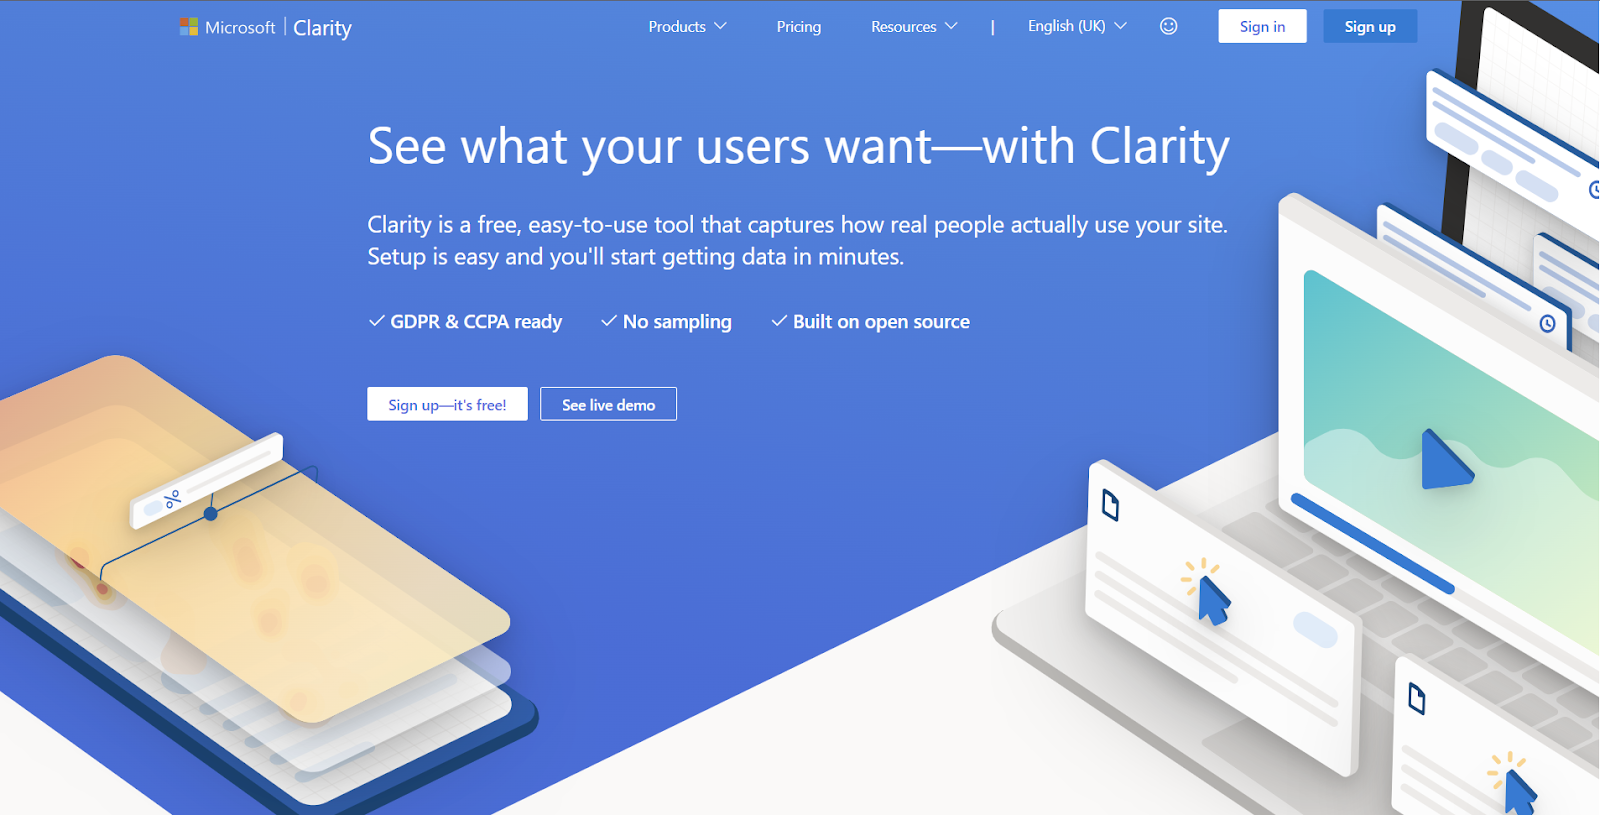
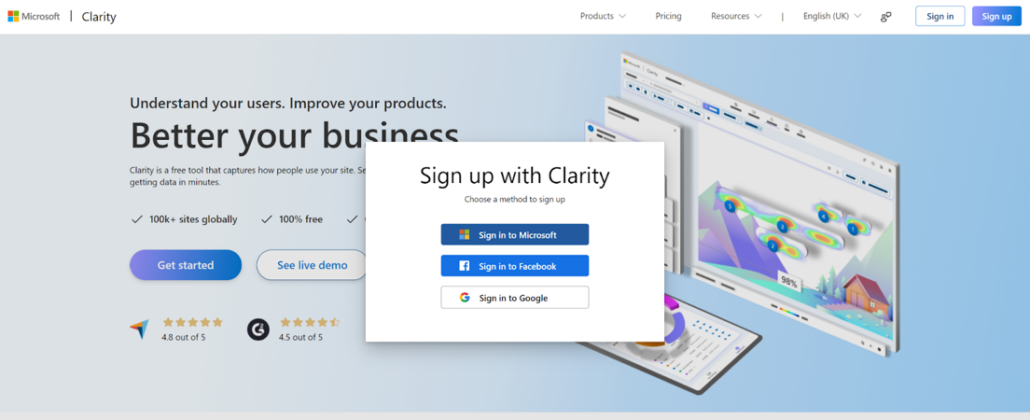
To create an account, visit clarity.microsoft.com and click the “sign up” button. For you to proceed, you will choose one of the following account creation methods:
- Sign up using a Microsoft account.
- Sign up using your Facebook account.
- Sign up using your Google account.
Depending on your selected option, you will get guided through a wizard that makes the process quick and easy.
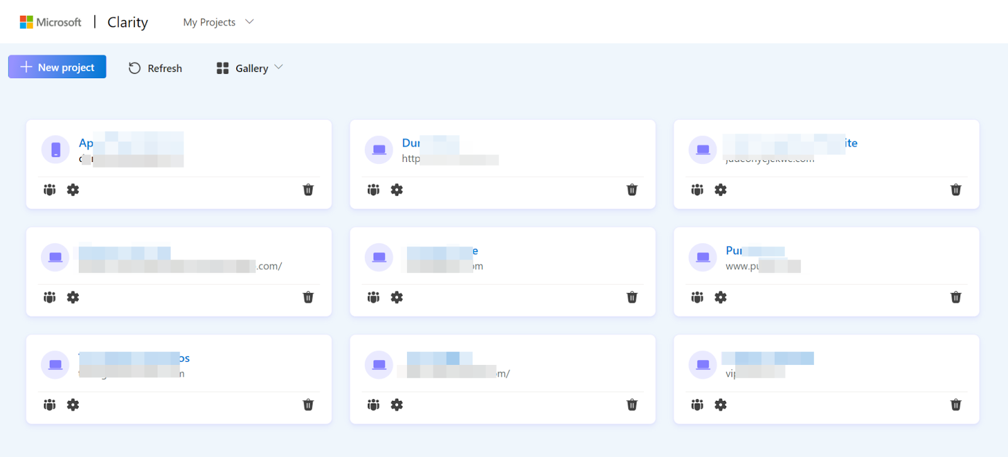
You will get redirected to the Microsoft Clarity dashboard upon successful account creation. If this is your first time accessing Clarity, you will get presented with a screen to create a new website project.
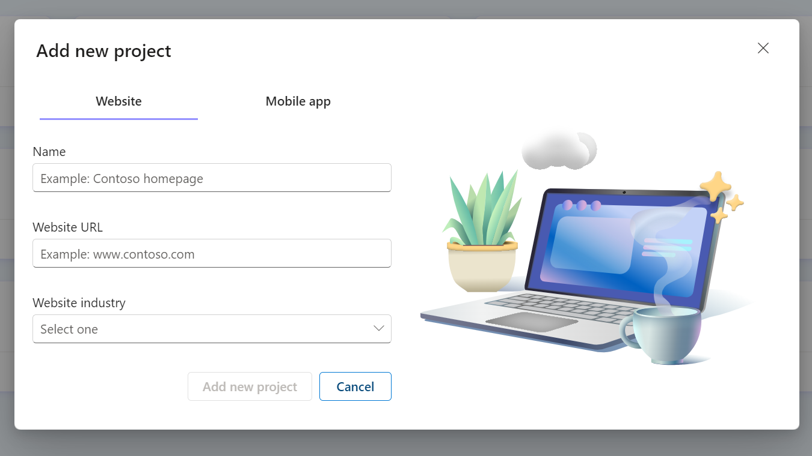
On the new screen, enter the project name and website URL.
In the next screen, you’ll have to click the “Get Tracking code” in the “Install Manually” card to copy the tracking code or project ID, which we’ll use in the instrumentation inside Google Tag Manager.
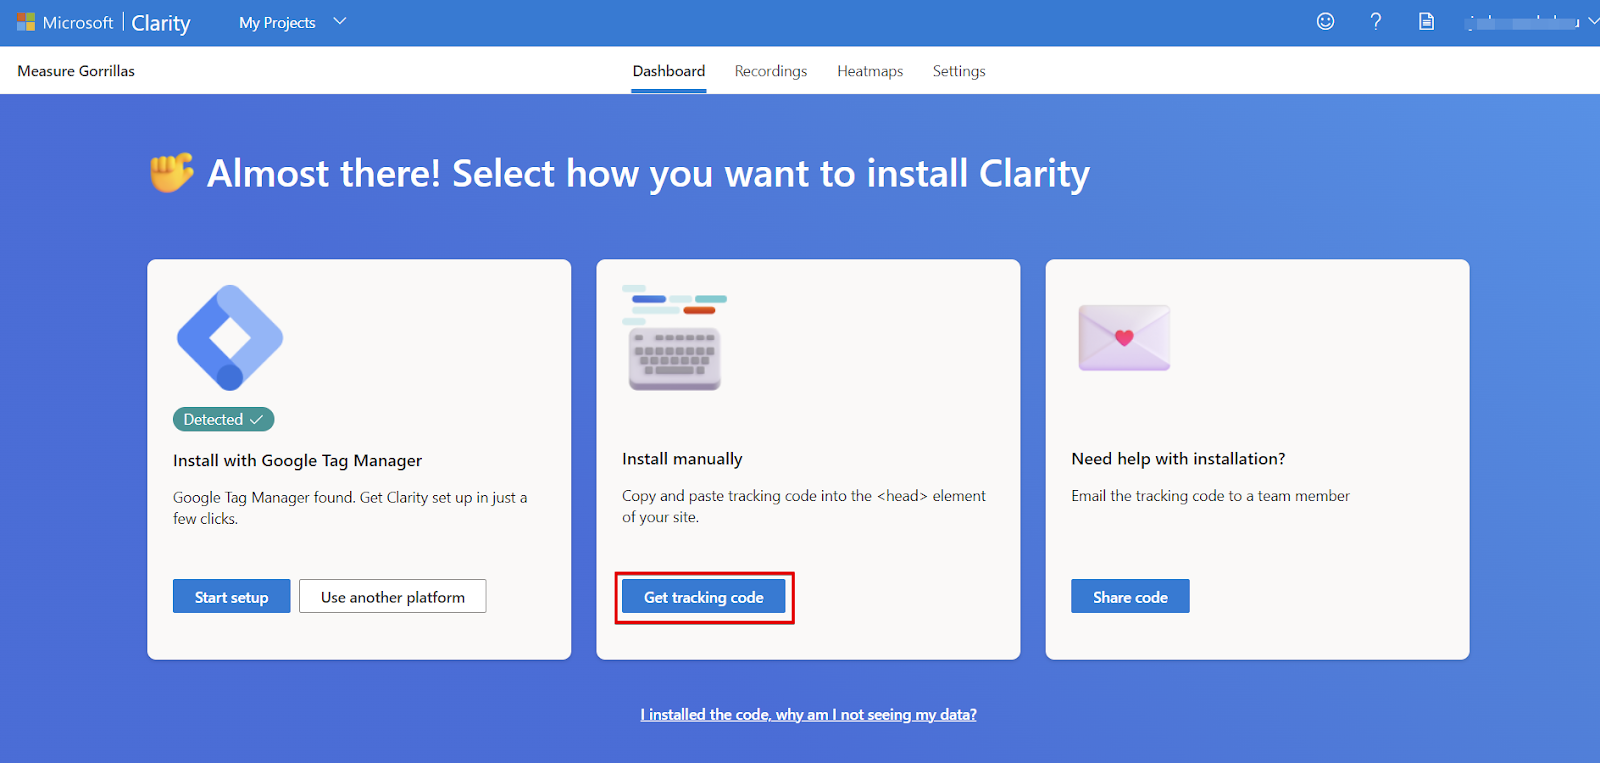
You can copy the whole tracking code or just the project ID, depending on the installation approach you take in Google Tag Manager.

How to Install Microsoft Clarity
Different methods exist to install the Clarity tracking script, but we will focus on using Google Tag Manager (GTM).
If you plan to use GTM, you have three options:
1. Custom HTML Tag Type:
It starts by creating a new tag and choosing the custom HTML tag type. Next, add the Microsoft Clarity tracking script and configure it to fire on all pages or when the user has given the required consent.

2. Native Microsoft Clarity Custom Template:
Add the custom template from the tag template gallery. Then, input your project ID and set the trigger, and you’re ready.
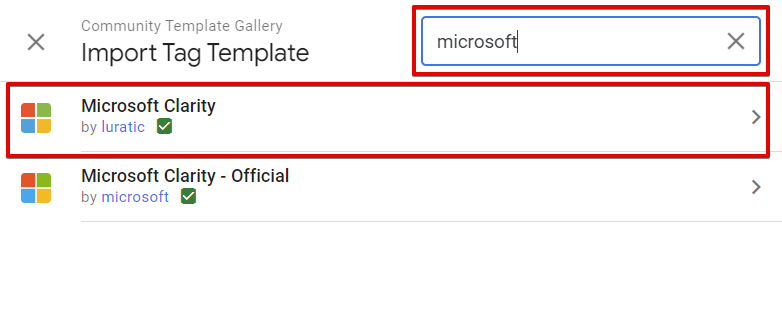
From the “Choose tag type” panel, click on the custom tag template community gallery.

Use the search term “Microsoft” and select the official one created by “Microsoft”.

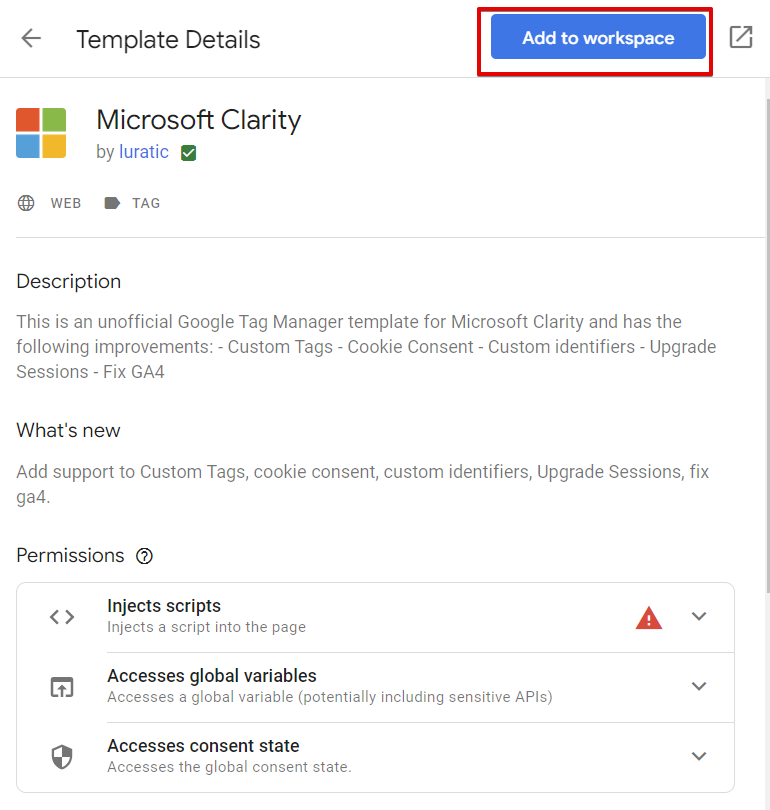
Click the “Add to workspace” button to add the template to your GTM container.

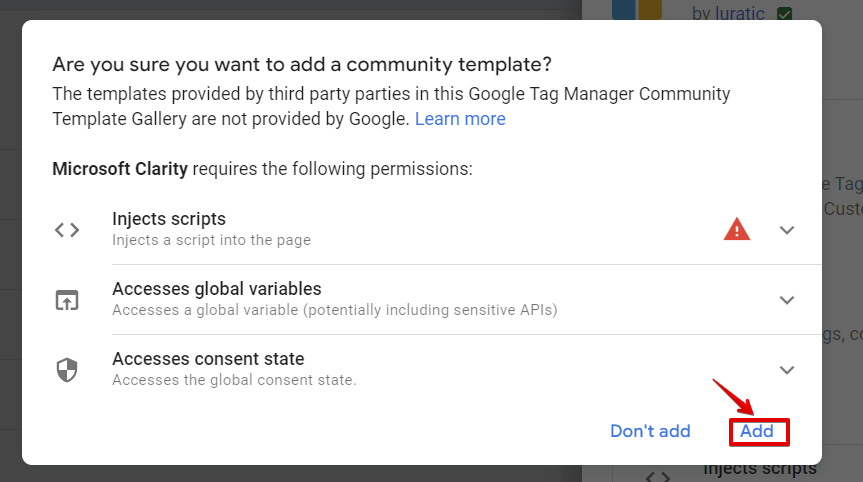
Select “Add” to proceed.

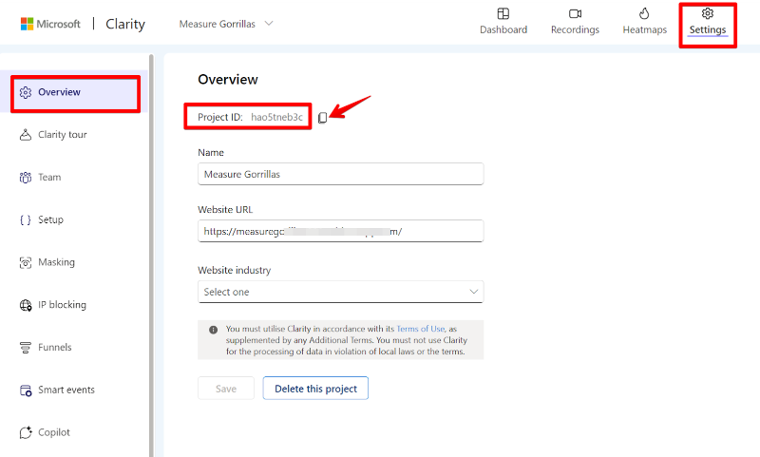
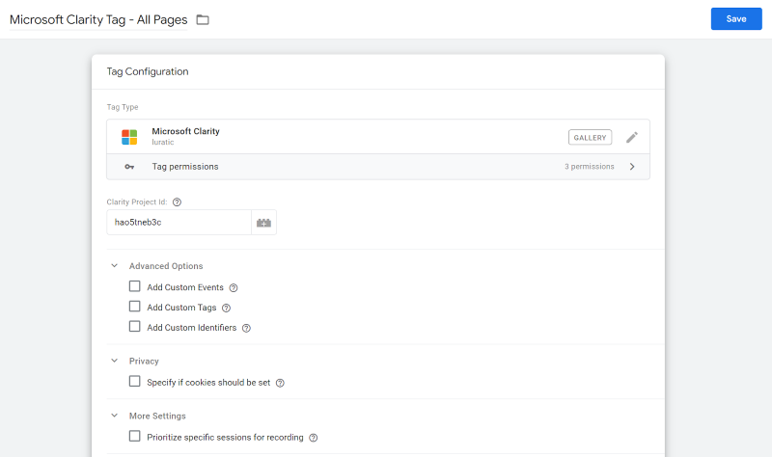
Enter your Microsoft Clarity project ID into the field marked in the image below.

You can copy that in the “Overview” section in the ‘Settings” view of Microsoft Clarity.
3. Luratic’s Custom Template:
This template simplifies the custom configuration of Microsoft Clarity and facilitates easy installation. First, search for “Microsoft Clarity” in the tag template gallery and select the template created by Luratic. Then, add your Clarity project ID, make the necessary configurations, save your tag, and set it to fire on all pages or when the user grants the appropriate consent.
As we did earlier, navigate to the custom tag template community gallery, search for “Microsoft”, and choose the template provided by “Luratic”.
Click the “Add to workspace” to import the tag template.
Click “Add” to proceed.
Insert your Clarity project ID, and I’ll explain other settings as we move along in the tutorial.
How To Install Microsoft Clarity Using Piwik Pro Tag Manager
For websites utilising the Piwik Pro analytics and tag manager suites, there is an option to install Microsoft Clarity through the Piwik Pro tag manager. This lets you keep all your tags within their Tag Management Solution (TMS).
The process is simple and straightforward. To implement the Microsoft Clarity tracking script, follow these steps within the Piwik Tag Manager suite:
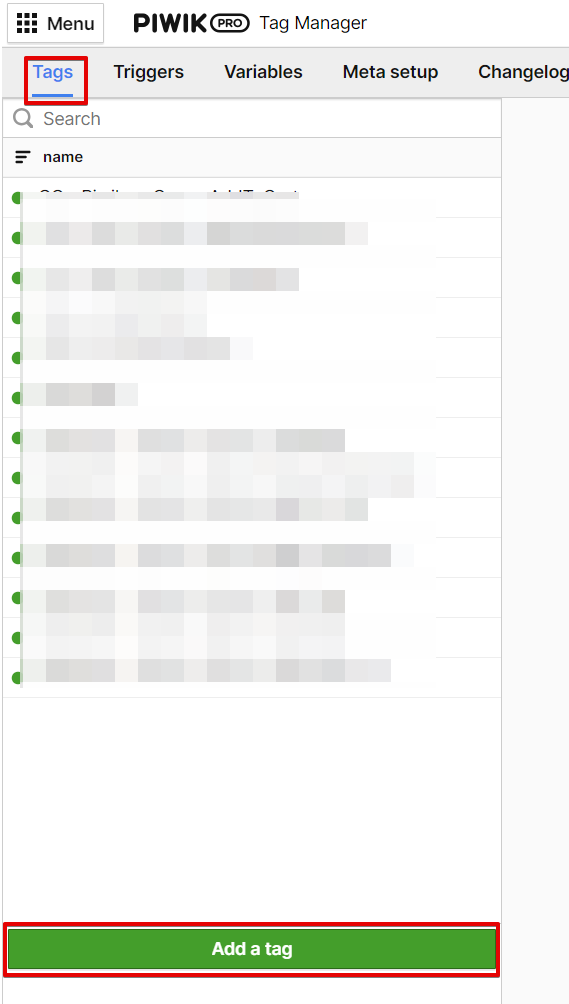
Navigate to their Tag Manager.

Go to the “Tags” section and click the “Add a tag” button.
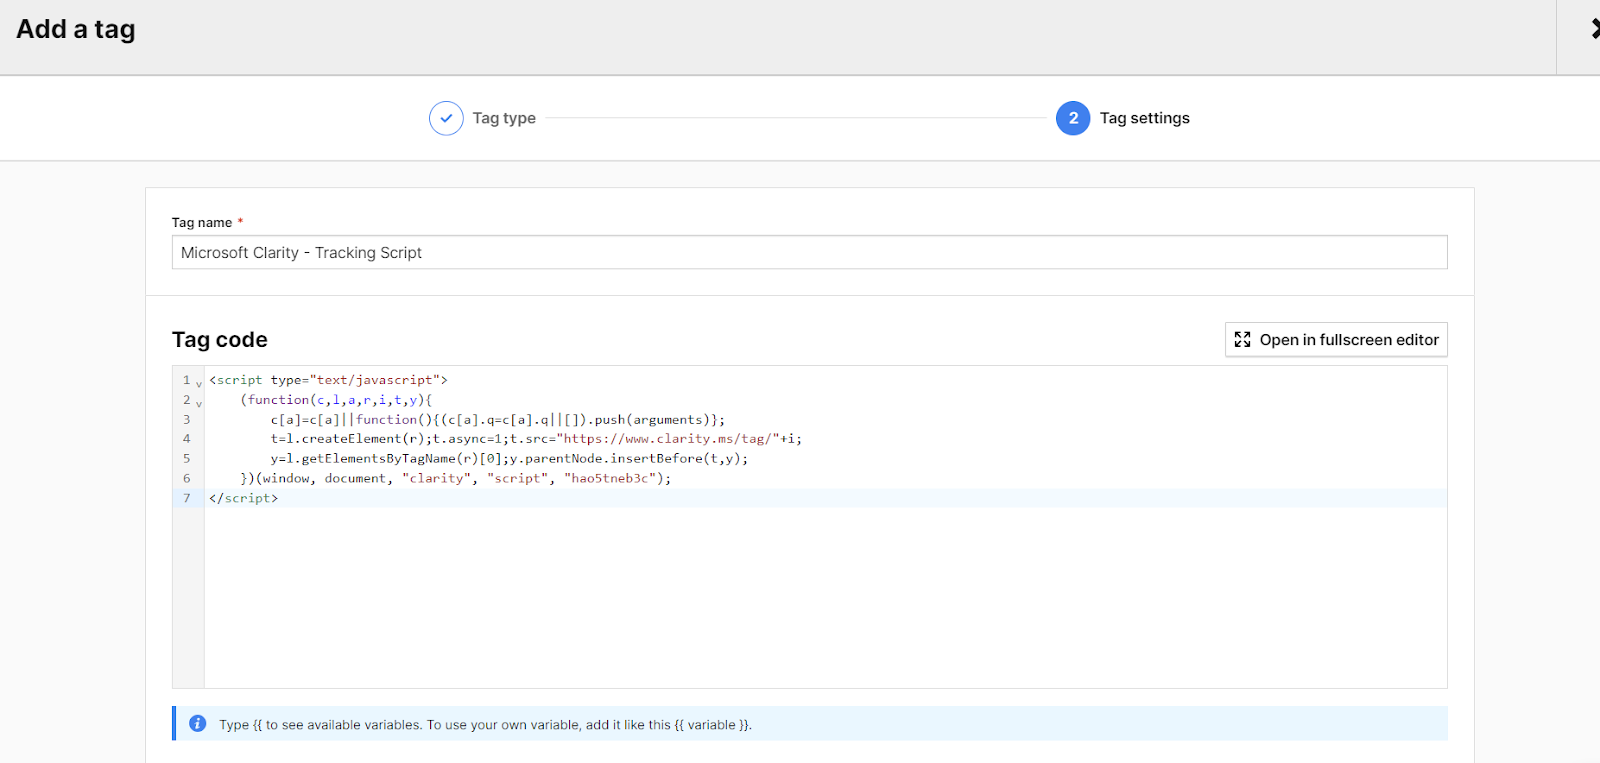
Ensure you have selected the “Async tag” tag type and then choose the “Custom Code” tag type. Provide a name for your tag and proceed to the next step.

In the code field, insert your Clarity tracking script. Configure the necessary privacy settings as required.
Add the trigger that will activate the tag when the page loads.
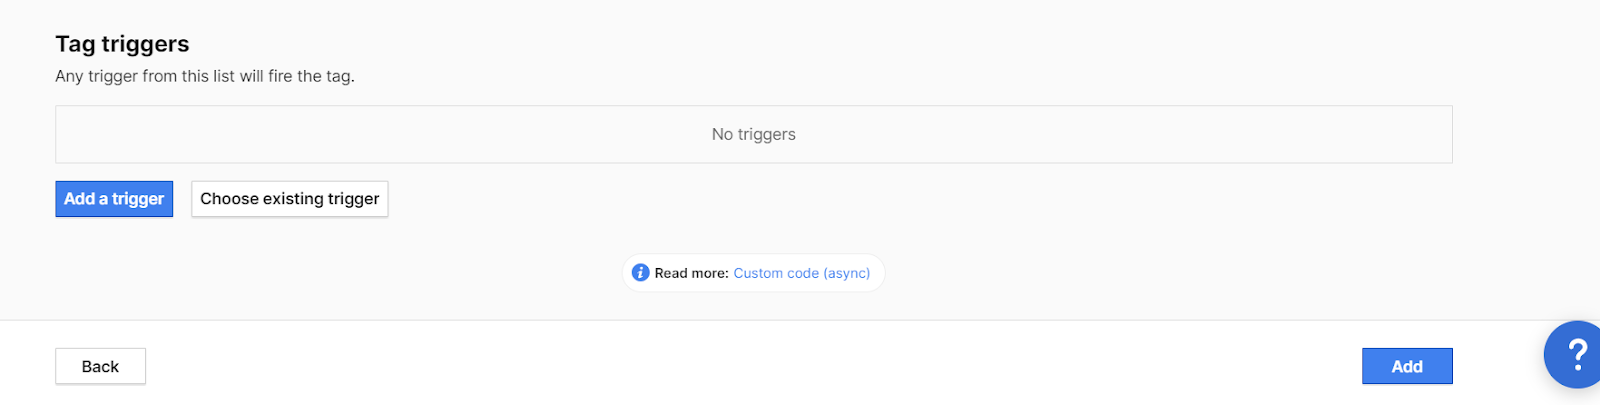
Save the tag and publish your container.
Following these steps will successfully integrate Microsoft Clarity with your website using the Piwik Pro tag manager.
While adopting any of the GTM instrumentation options mentioned above to you, it may seem like adding the code is a final step. However, some action items still need to be completed within Microsoft Clarity and Google Tag Manager.
In the next couple of this article’s sections, we will cover the configurations required within Microsoft Clarity and educate you on the product’s different reporting interfaces. Afterwards, I will explain what additional implementation you should consider to have in your instrumentation.
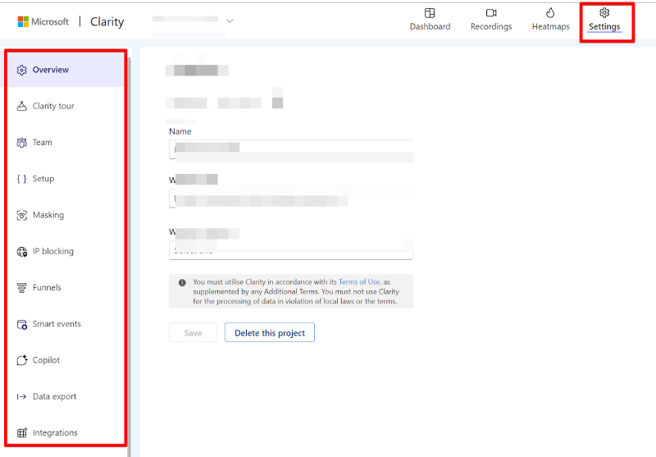
Tour of the Configuration Settings in Microsoft Clarity
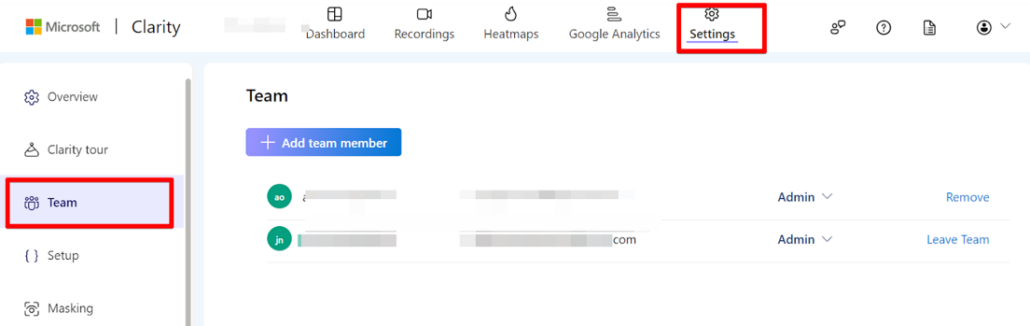
To access the configuration settings in Microsoft Clarity, you’ll need to navigate to the “Settings” tab through the top menu navigation.
Within the settings, you will find seven additional side tabs that allow for different configurations within Microsoft Clarity:
- Overview
- Clarity Tour
- Team
- Setup
- Masking
- IP Blocking
- Funnels
- Smart Events
- Copilot
- Data Export
- Integrations
Here is an explanatory detail of what you can do in each tab:
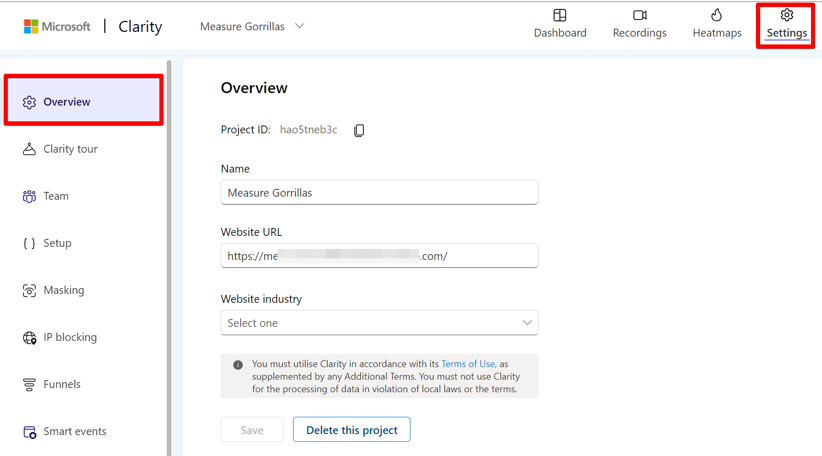
Overview:
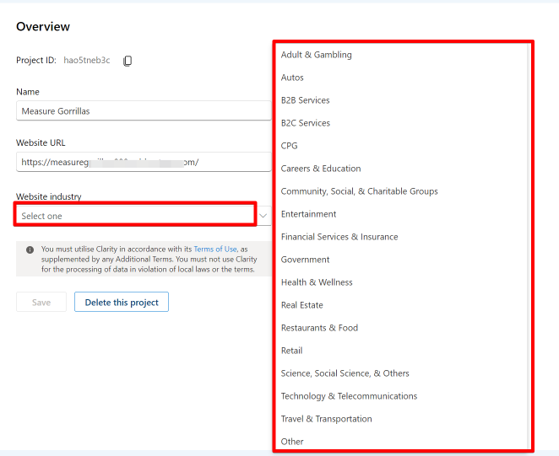
In this tab, you can change the Clarity project name and website URL, select your site category, and copy the project ID. You can also delete projects that are no longer needed.
This is a list of site categories that you can choose from.
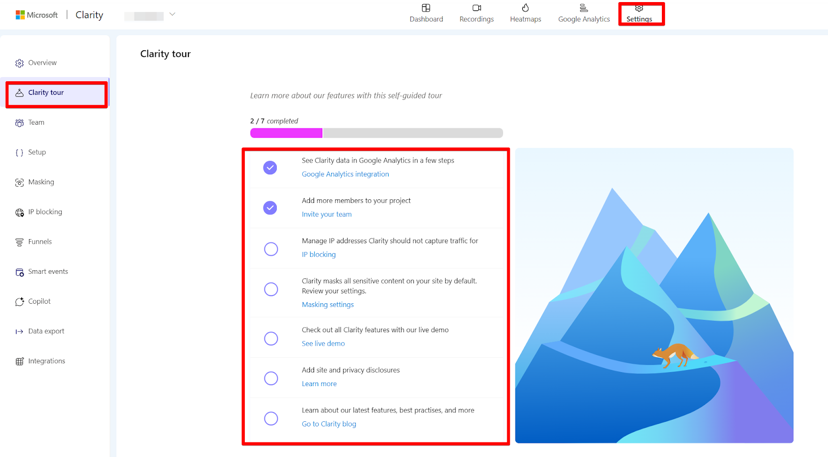
Clarity Tour:
Similar to the Google Analytics 4 setup assistant, this tab helps identify any incomplete implementation tasks according to Microsoft Clarity. Configured completed items are marked with a green check mark and provide links to the corresponding configurations within Microsoft Clarity.
Team:
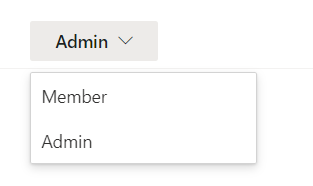
Here, you can add or remove access to the Clarity project. Microsoft Clarity offers two access types: “Member” and “Admin,” with “Admin” having the highest level of access.
You’ll also get the flexibility of assigning access types.
Setup:
The “Setup” tab offers several options within three sections:
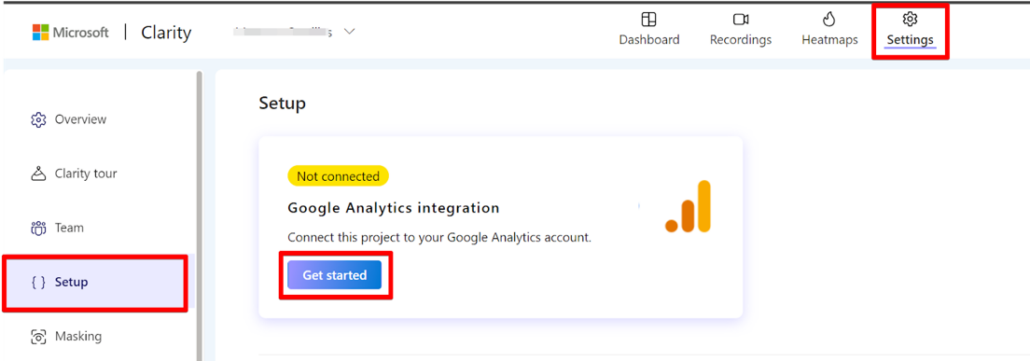
1. Overview:
You can integrate Microsoft Clarity with Google Analytics 4 within the Setup interface. It is advisable to utilise both the native and manual integration methods. This integration will generate a reporting interface known as “Google Analytics.”
Integrating Microsoft Clarity and Google Analytics 4 Using the Native Integration:
To integrate both platforms:
- Click the “Get Started” button.
- Sign in or select the Google account with access to the GA4 property.
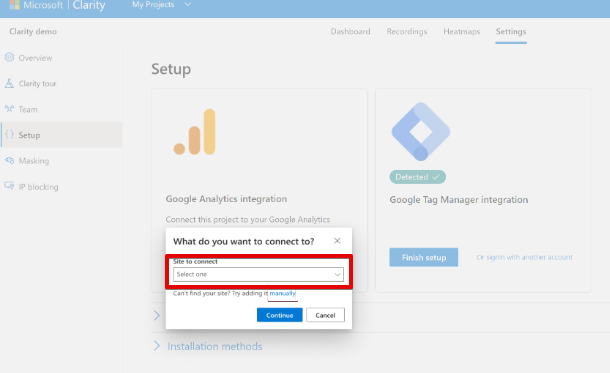
- Proceed with authorisation and select the GA4 property from the dropdown menu.
- Save the settings to complete the connection.
Authenticate your Google account, which has access to the GA4 account.

In the dropdown, you’ll have to select the GA4 property you want to connect with the Microsoft Clarity project. Click the save button to integrate both stacks.
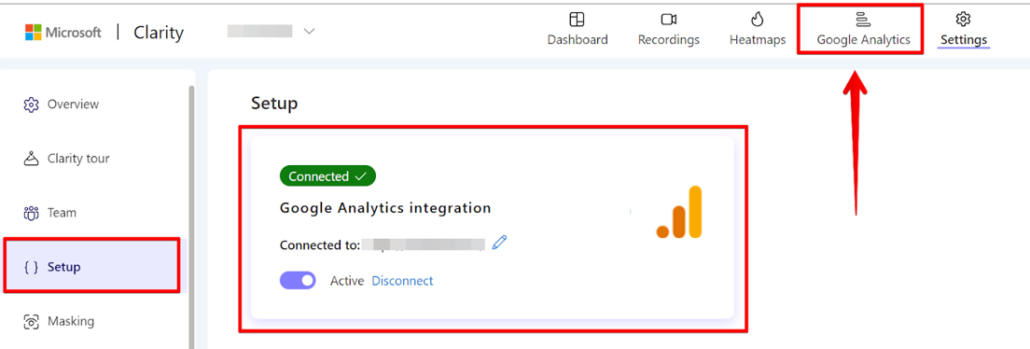
Once both tools are successfully connected, you will see a ” Connected ” status in your Google Analytics integration card.
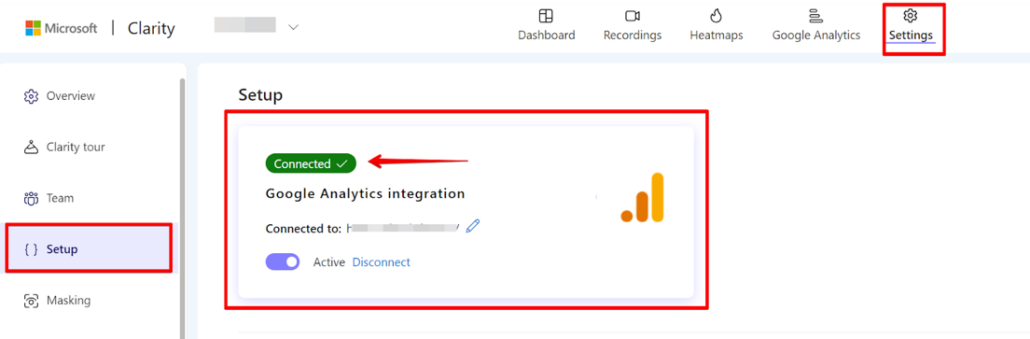
Also, you’ll gain access to the “Google Analytics” report, which I’ll explain later in this tutorial.
Further steps are required within GA4 to register “claritydimension” as a custom dimension. Connecting both stacks enables access to session recording playback URLs within GA4.
The data can be used in the standard reports in GA4.
The data is also usable in Google Analytics (GA4) explorations.

It’s essential to be aware of the limitations and issues with the automatic native integration, and I’ll recommend using both native and manual integration for better results. You should visit the Integration section of this Microsoft Clarity article (or read this integration guide) to understand some of the issues with native integration and how best to resolve them.
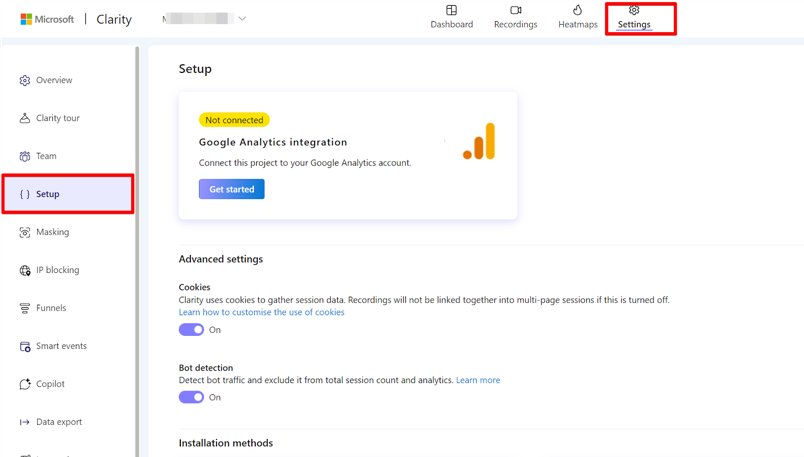
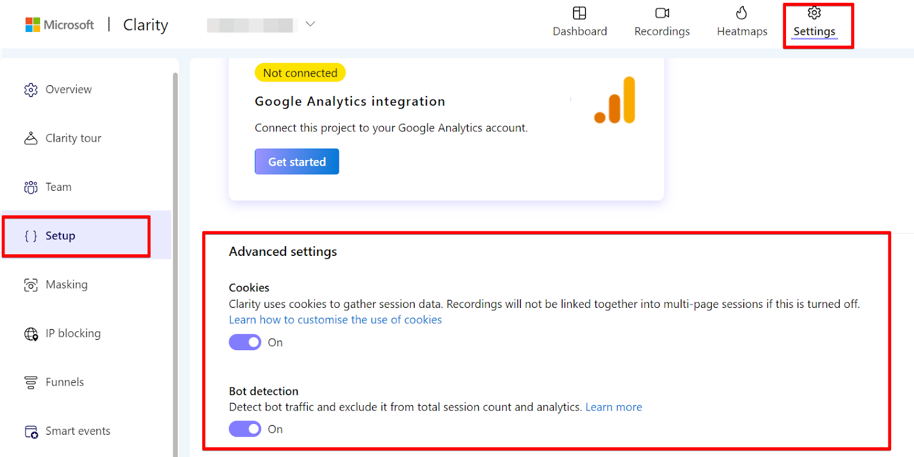
2. Advanced Settings:
This part of the setup configurations allows you to decide whether Clarity should use cookies to gather session data. It is smart to enable this, as it affects how sessions and metrics get counted.
Also, you should check if “bot detection” settings are enabled. As it helps exclude bot traffic from reporting.
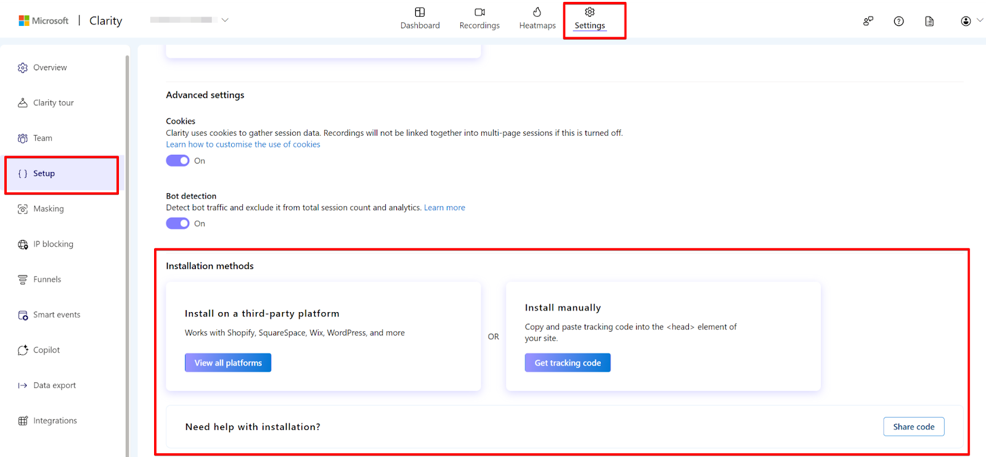
3. Installation Methods:
In this part of the setup settings, three actions can be done here;
- Copy the Clarity tracking script.
- Choose Microsoft Clarity’s partner integrations.
- Email the installation code to team members.
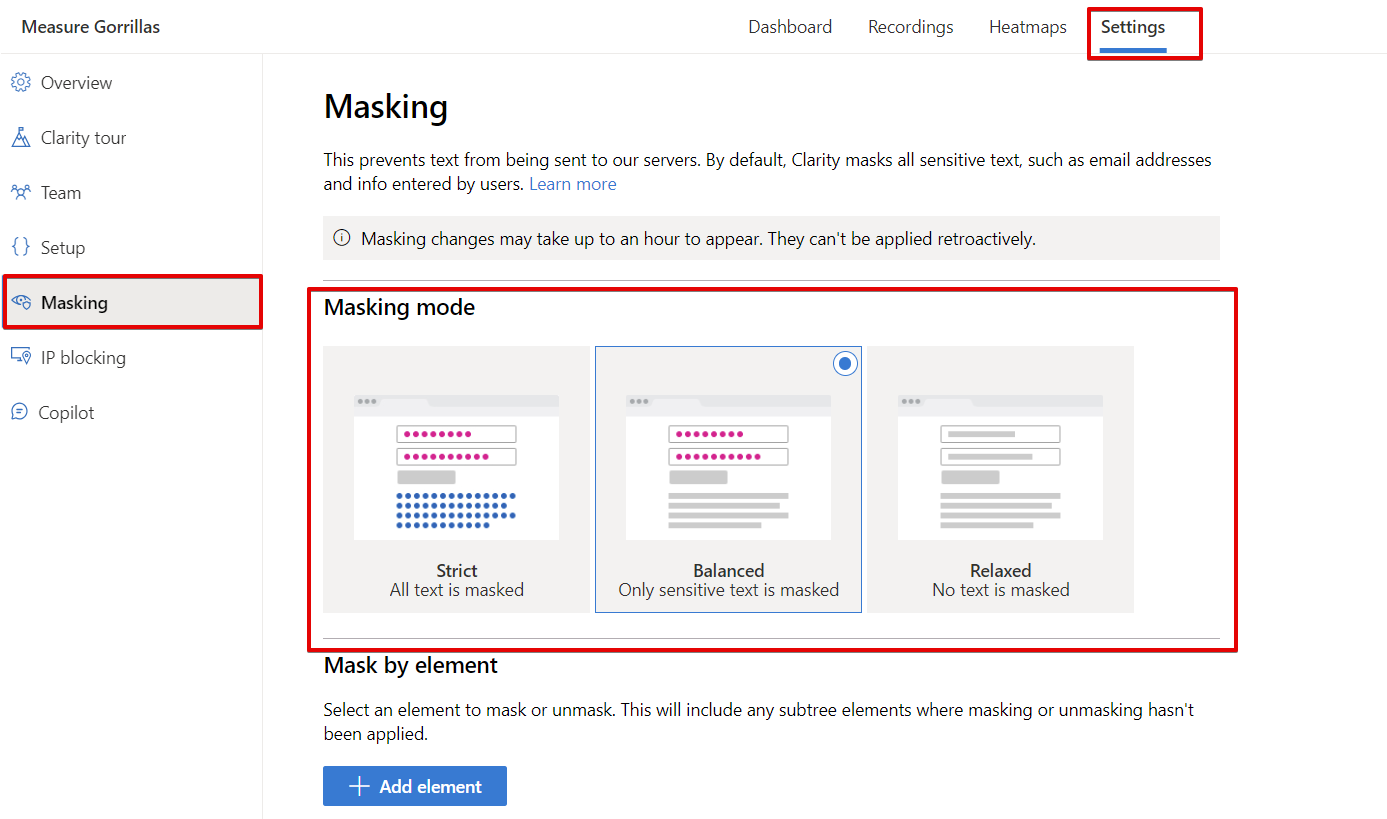
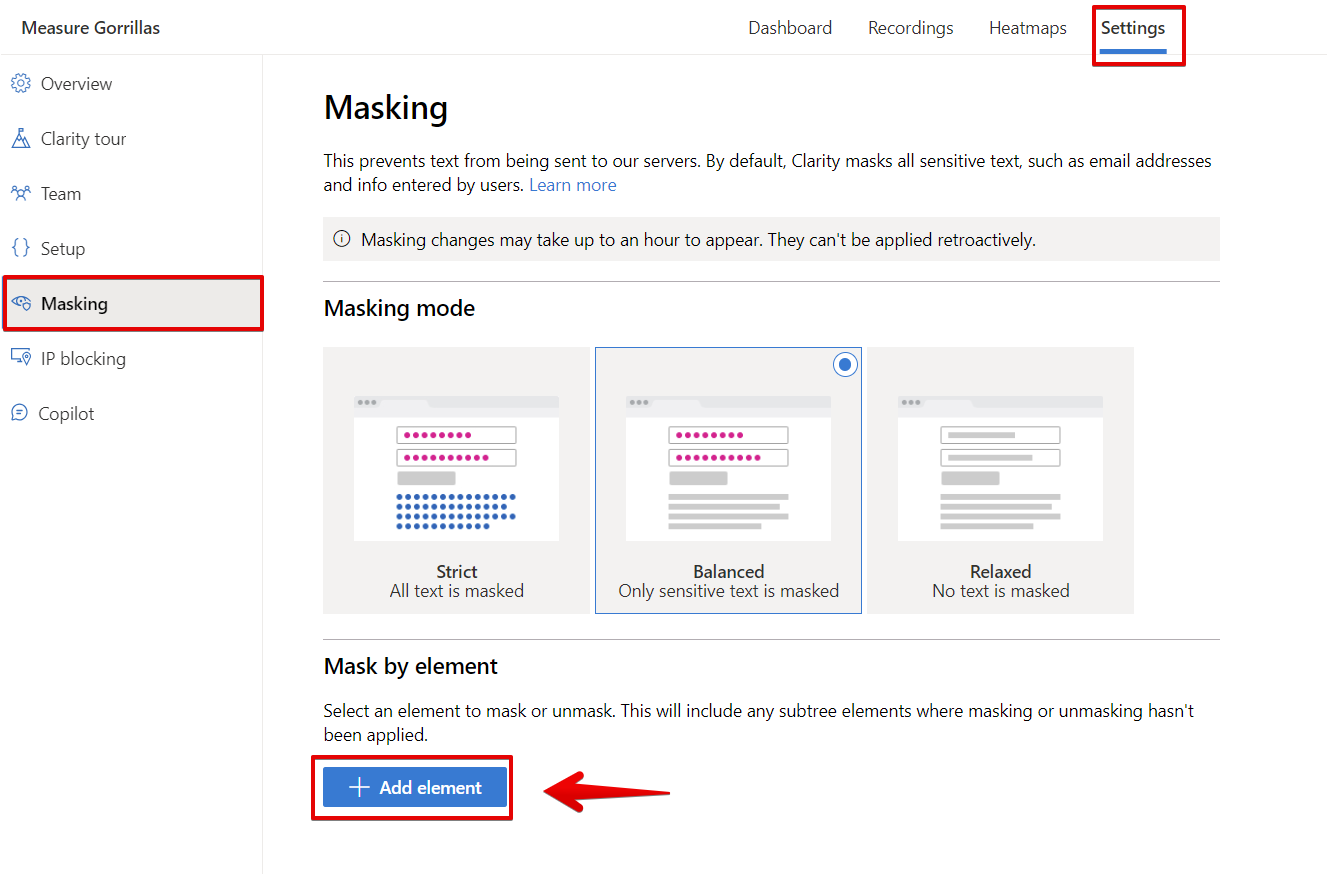
Masking:
The masking feature prevents certain text from being sent to Microsoft Clarity’s servers. By default, Clarity masks sensitive text like email addresses and user-entered information. In addition, the “masking mode” is set to “Balanced” by default, where only sensitive text gets masked.
However, you have the option to select “Strict” or “Relaxed” mode. Using “Balanced” is recommended to ensure significant compliance with privacy regulations.
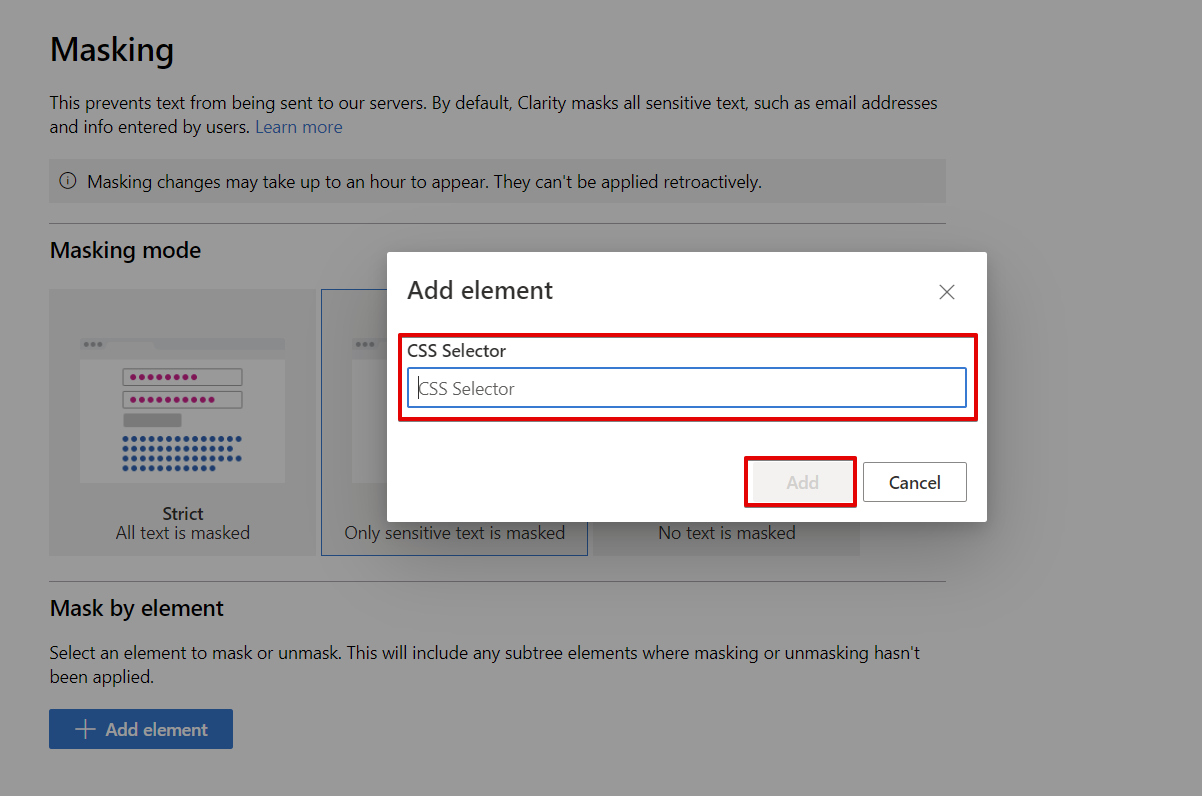
You can also manually mask certain elements using the “mask by element” feature, where you’ll use CSS selectors to control what Clarity records in session recordings. Note that masking changes may take up to an hour to appear and cannot be applied retroactively.
Add your CSS selector and click the “Add” button to complete that element’s manual masking setup process.
IP Blocking:
Within the settings section, you have the ability to block an IP address using either the exact IP address or a CIDR range. This feature helps block internal traffic or known bot IP addresses.

To block internal traffic, simply click the “Block IP Address” button. Assign a name to the IP address for easy identification. If you currently use the IP that needs to be blocked, you can click “Block my current IP.” Alternatively, you can add the IP address or CIDR range in the provided field. Then, click “Add” to block traffic originating from the specified IP address. Note that you can have multiple IPs blocked.

It is possible if you’re wondering about adding an IP regex. However, you first need to create the IP regex and then utilise the “GA4 IP Filters” tool to convert the regex IP address into a CIDR range.
If you prefer a non-IP-based approach, check out this article that provides detailed instructions on filtering internal traffic using a non-IP methodology.
Copilot:
In this settings tab, you can disable “Copilot.” However, I won’t advise doing so, as it would prevent you from seeing if you have completed the Copilot onboarding checklist. Completing the checklist requires your website’s Microsoft Clarity tracking script and a connection to GA4 (Google Analytics 4).

Understanding the Different Microsoft Clarity Reporting Interfaces
A deep understanding of the Microsoft Clarity interface is essential to derive value from the product, even with a perfect setup. So let’s explore the Microsoft Clarity interface and explain the meaning of each reporting section.
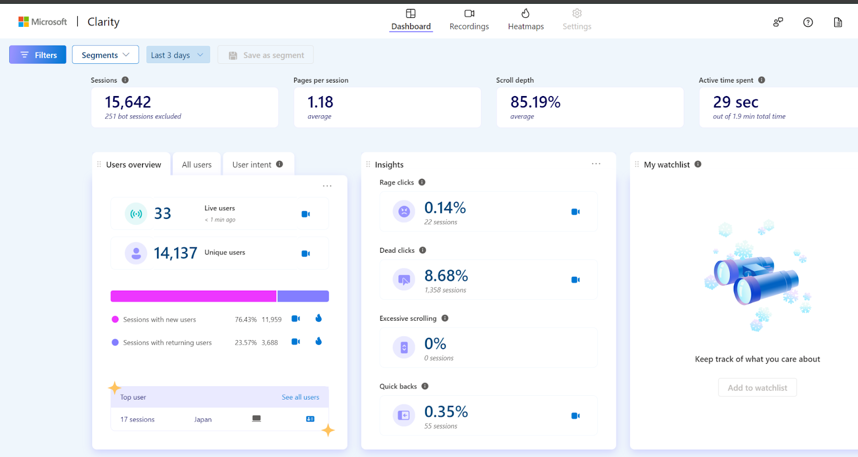
Dashboards (Insights):
The dashboard presents bite-sized information that can be further explored using session recordings and heatmaps in Microsoft Clarity. The report cards on the dashboard provide you with different categories of insights, as shown in the image below.
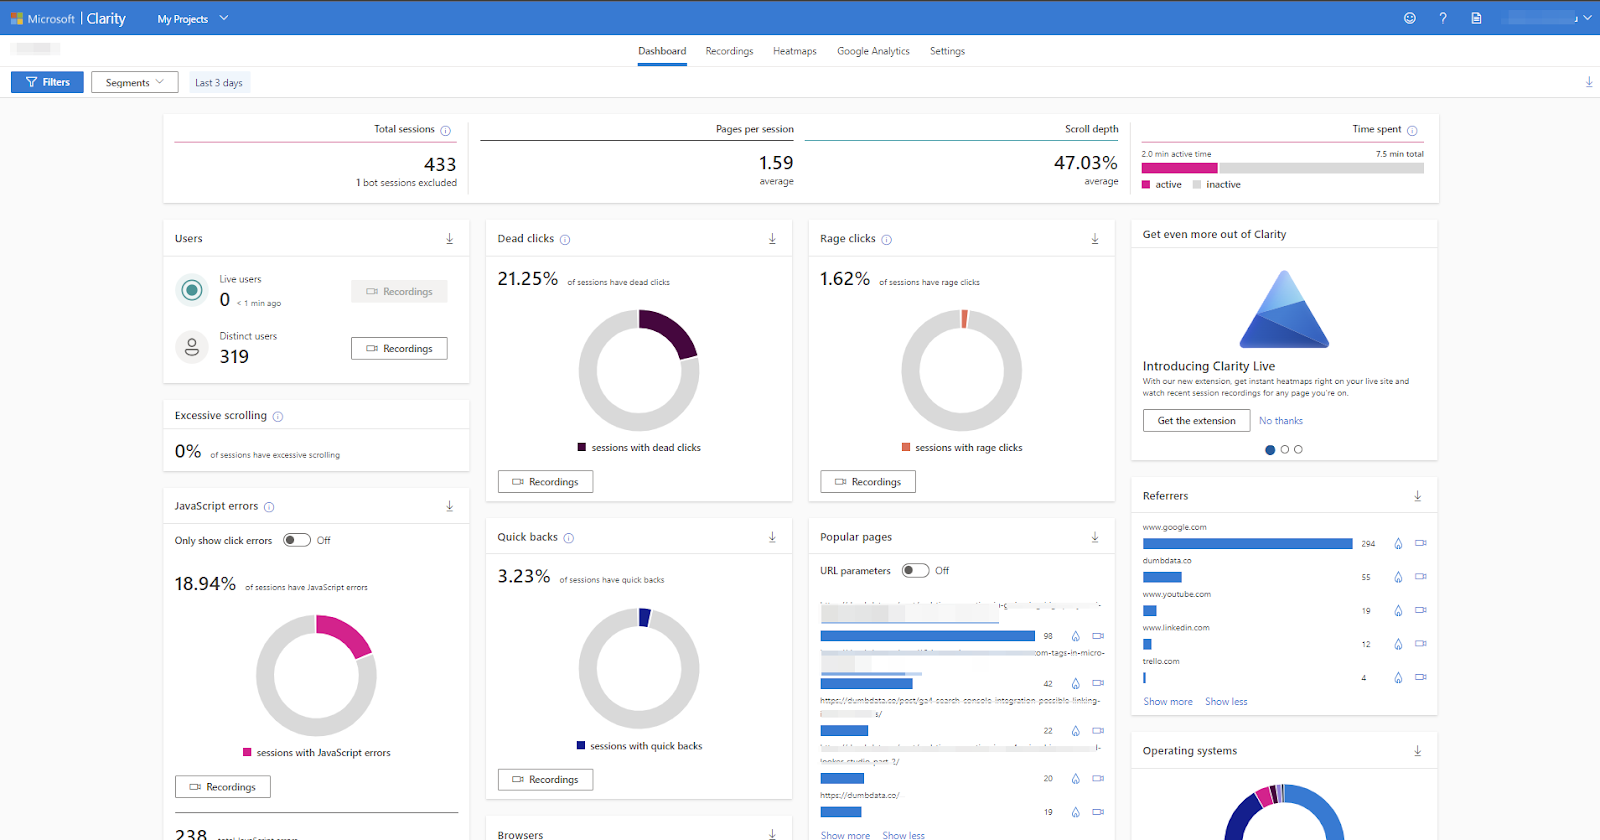
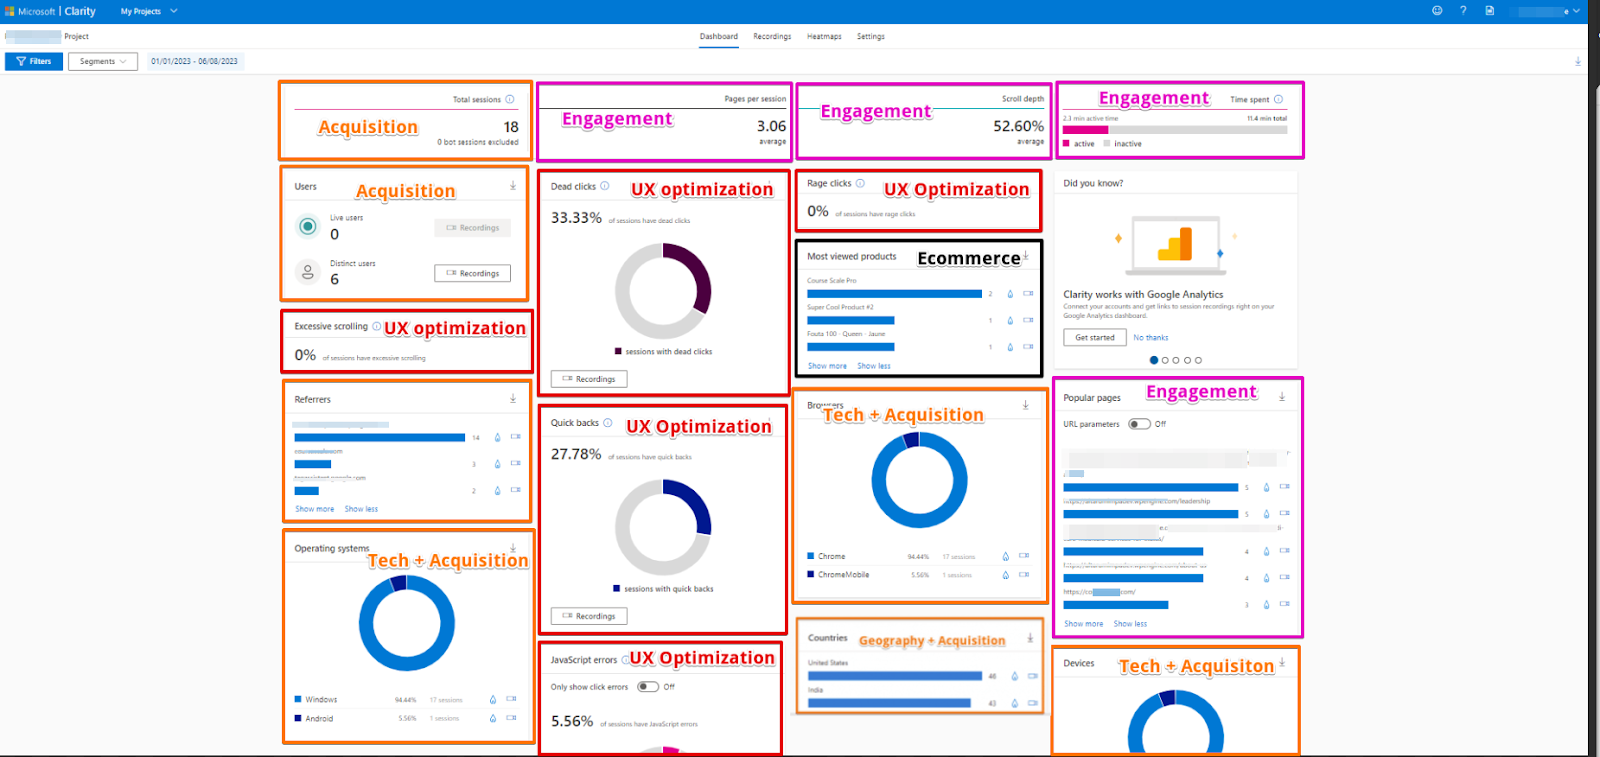
The insights on the dashboard can be grouped into the following categories:
- Acquisition
- Engagement
- UX optimisation
- Technology + Acquisition
- Geography + Acquisition
- E-commerce
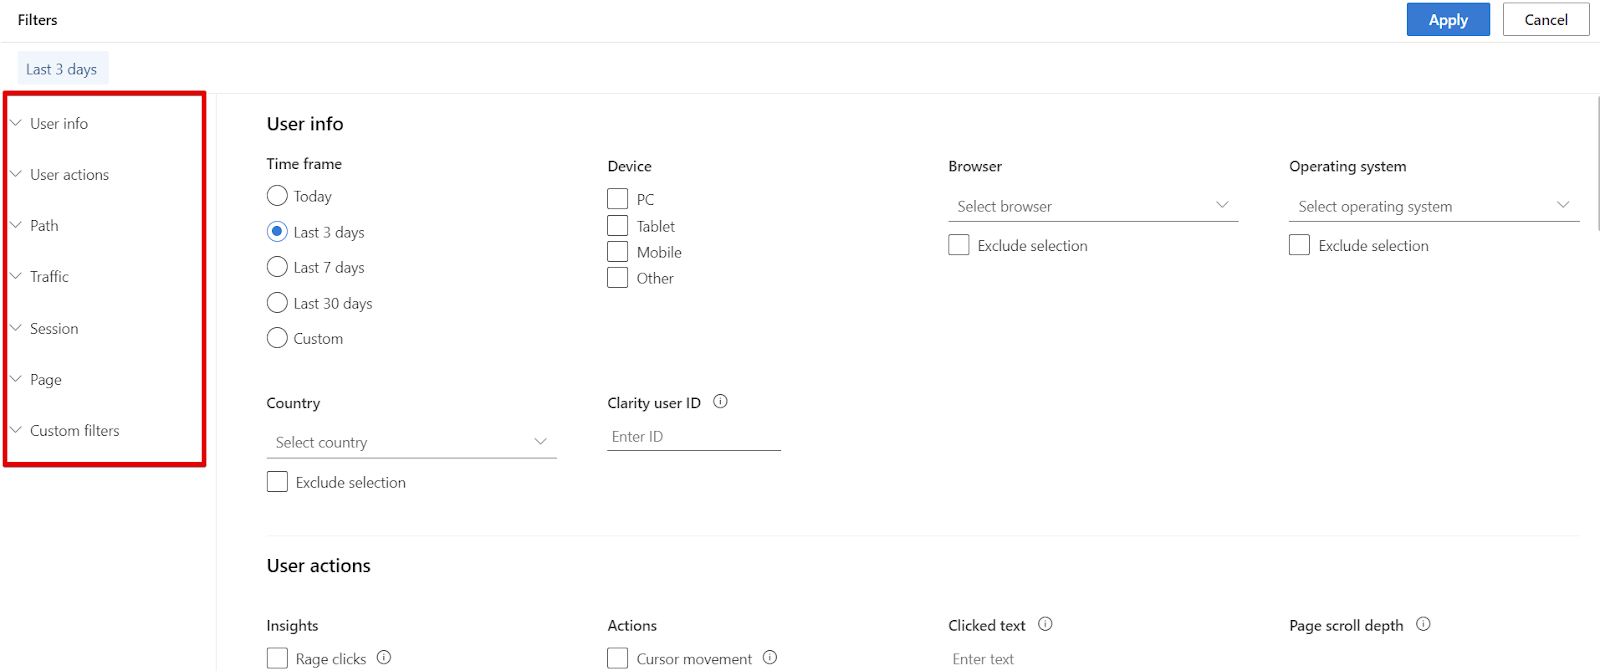
You can apply session filters and segments to the dashboard. Filters applied to the dashboard will persist across other reports, except for the Google Analytics report. You can filter using various parameters, including user info, user actions, path, traffic, session, page, and custom filters.

- User Info (timeframe, device, browser, operating system, country, Clarity User ID)
- User Actions (types of clicks, scroll behaviour, mouse movement, etc.)
- Path (landing page, exit page and pages they visited)
- Traffic (referring site, traffic source, medium, campaign and channel)
- Session (session duration, session click count, and page count)
- Page (duration on a page, click count on a page, JavaScript errors, page visibility and hidden duration, page size and screen resolution)
- Custom Filters (custom tags, user ID, session ID, page ID and custom labels)
You can save the filter as a “Segment” by clicking the “save” option to initiate the creating process. Also, note that you can click the “clear” option to clear the filter.

Click the “Save as new” button to give your segment a name and save it to your project.
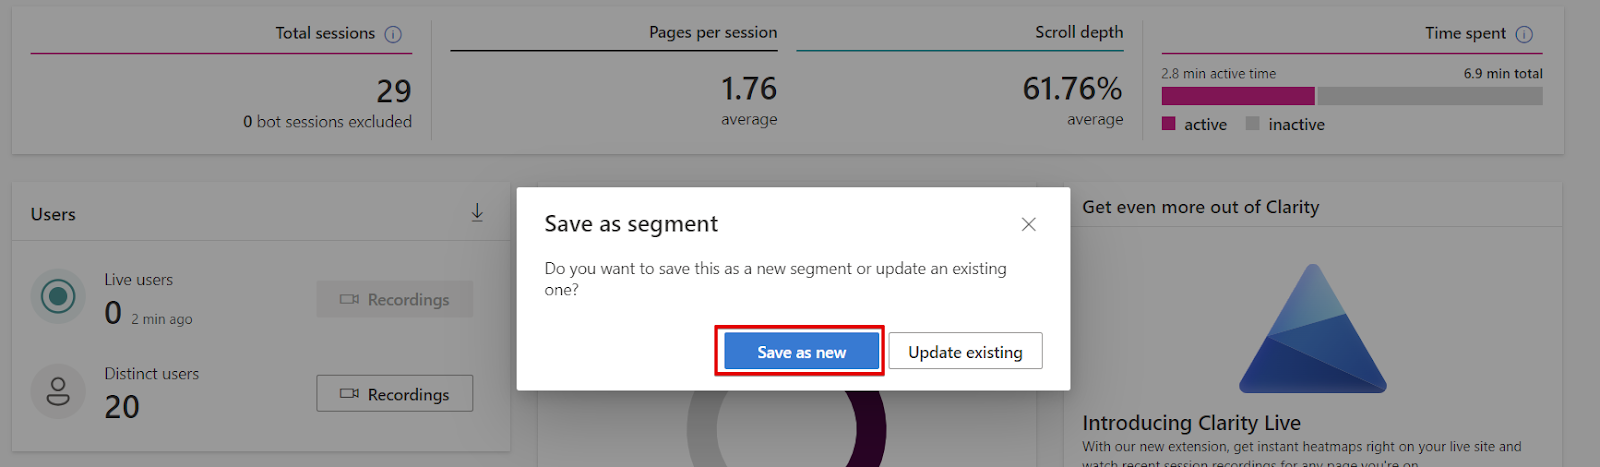
Give the segment a name and hit the save button.

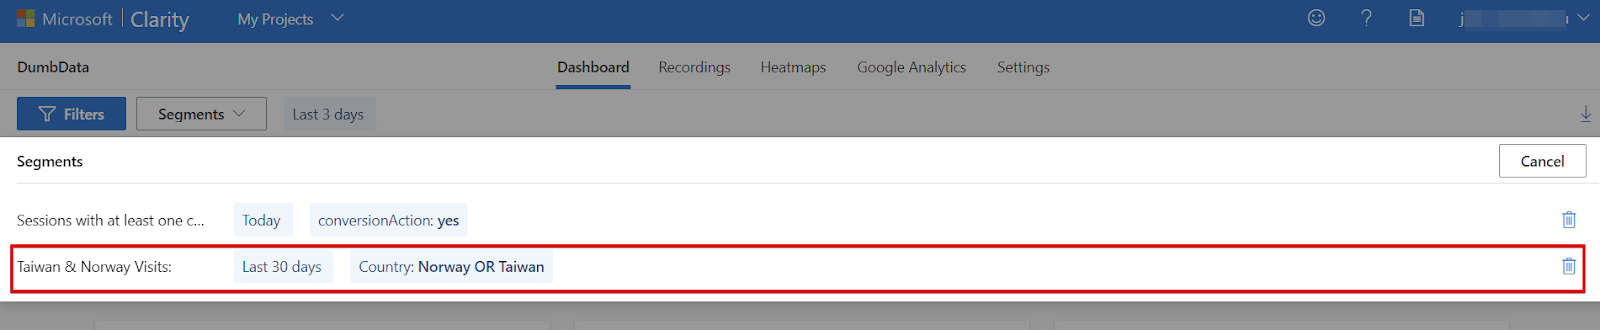
Find the segments by using the “Segments” dropdown field to select the segment and apply it to your report.

Choose the segment by clicking on it. Also, note that the “Delete” icon is to delete the segments.
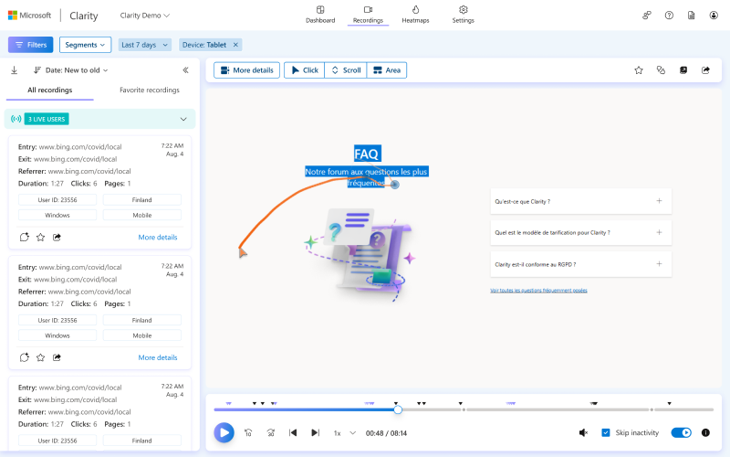
Recordings:
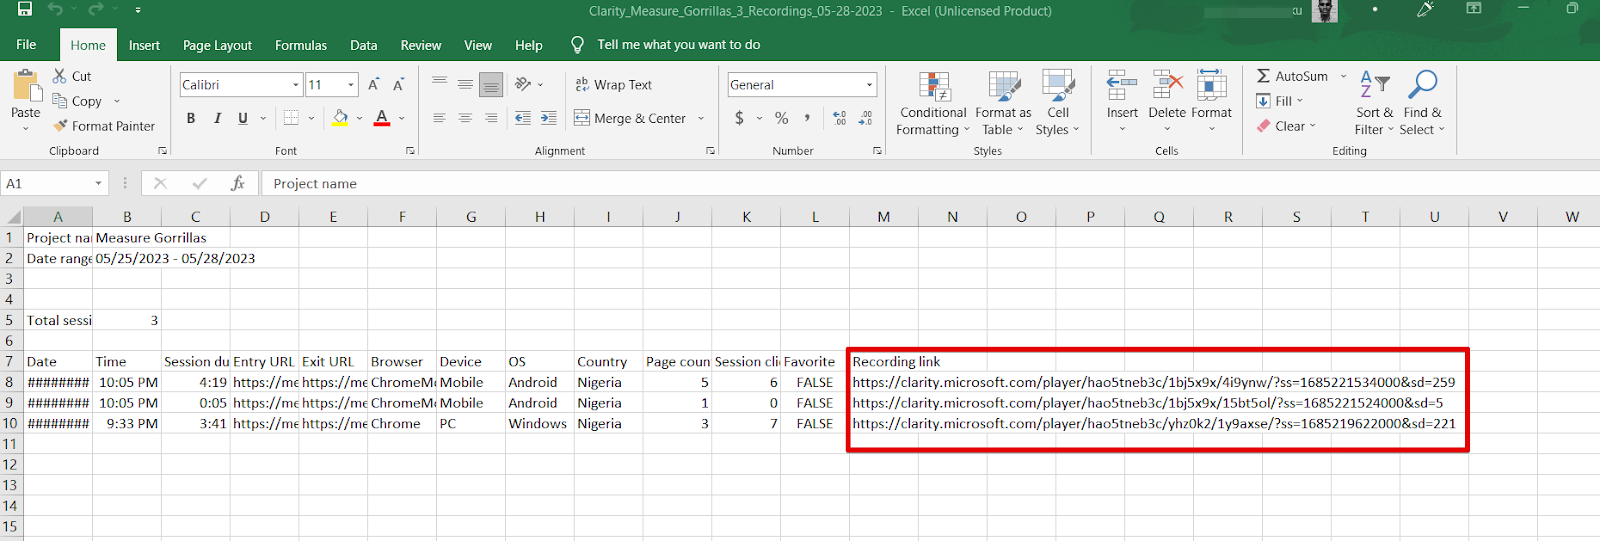
In this reporting section, you can watch recordings of real-time website visitors or previous website sessions of a user. You can view all your recordings, sort them according to your preferred order and factor, and even download them as CSV files.
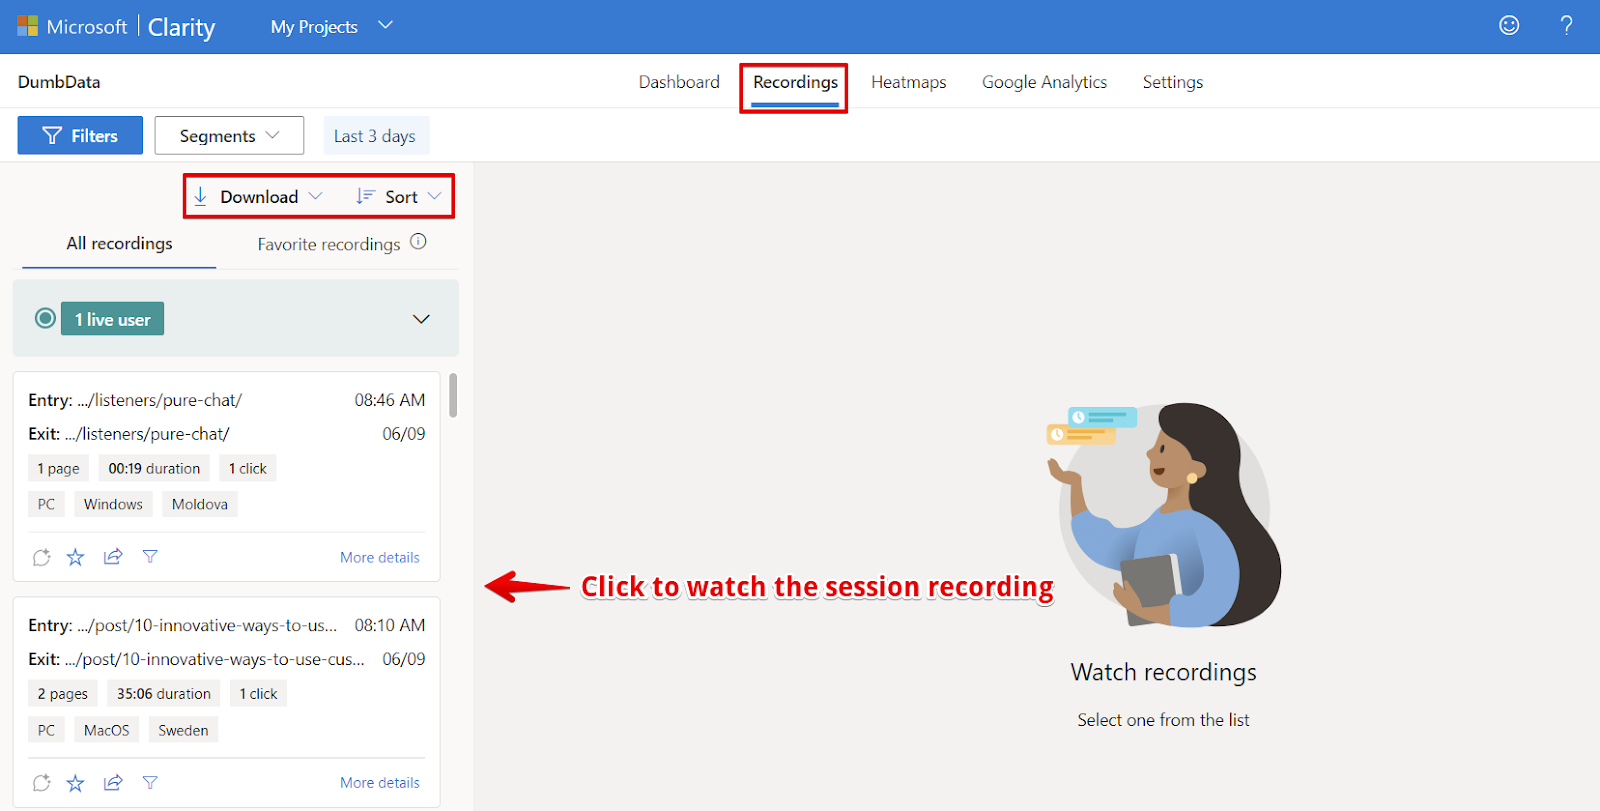
The CSV export includes a column with links to watch the session recording playback.
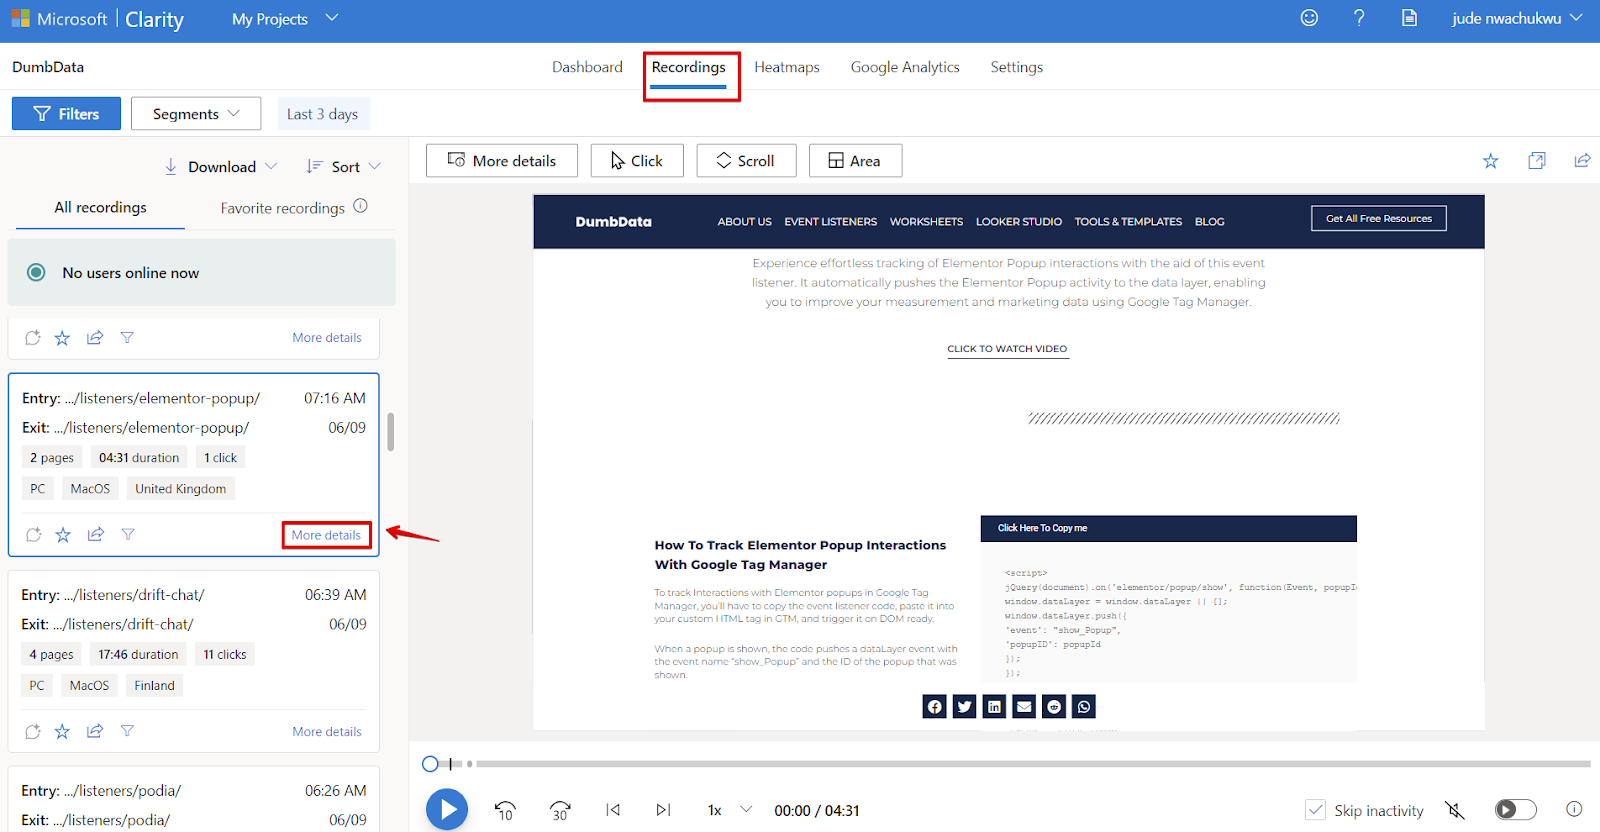
You can switch between “All Recordings” and “Favorite Recordings,” which are recordings you have starred.

To see the details of the session recording you’re watching, you’ll have to click the “more details” option.
When watching a recording, you’ll have two tabs on the left side of the session recording video player: “Session” and “Insights” (available for projects with Copilot enabled)

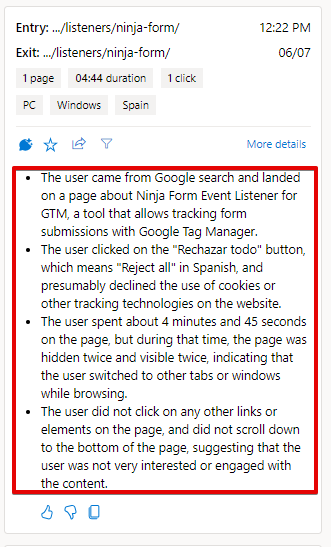
In the session info tab, you can access details about the session acquisition, user geography, device technology, and how the user entered and left the website during that session. You can also label the session recording and view a detailed breakdown of the user’s actions in that specific session.
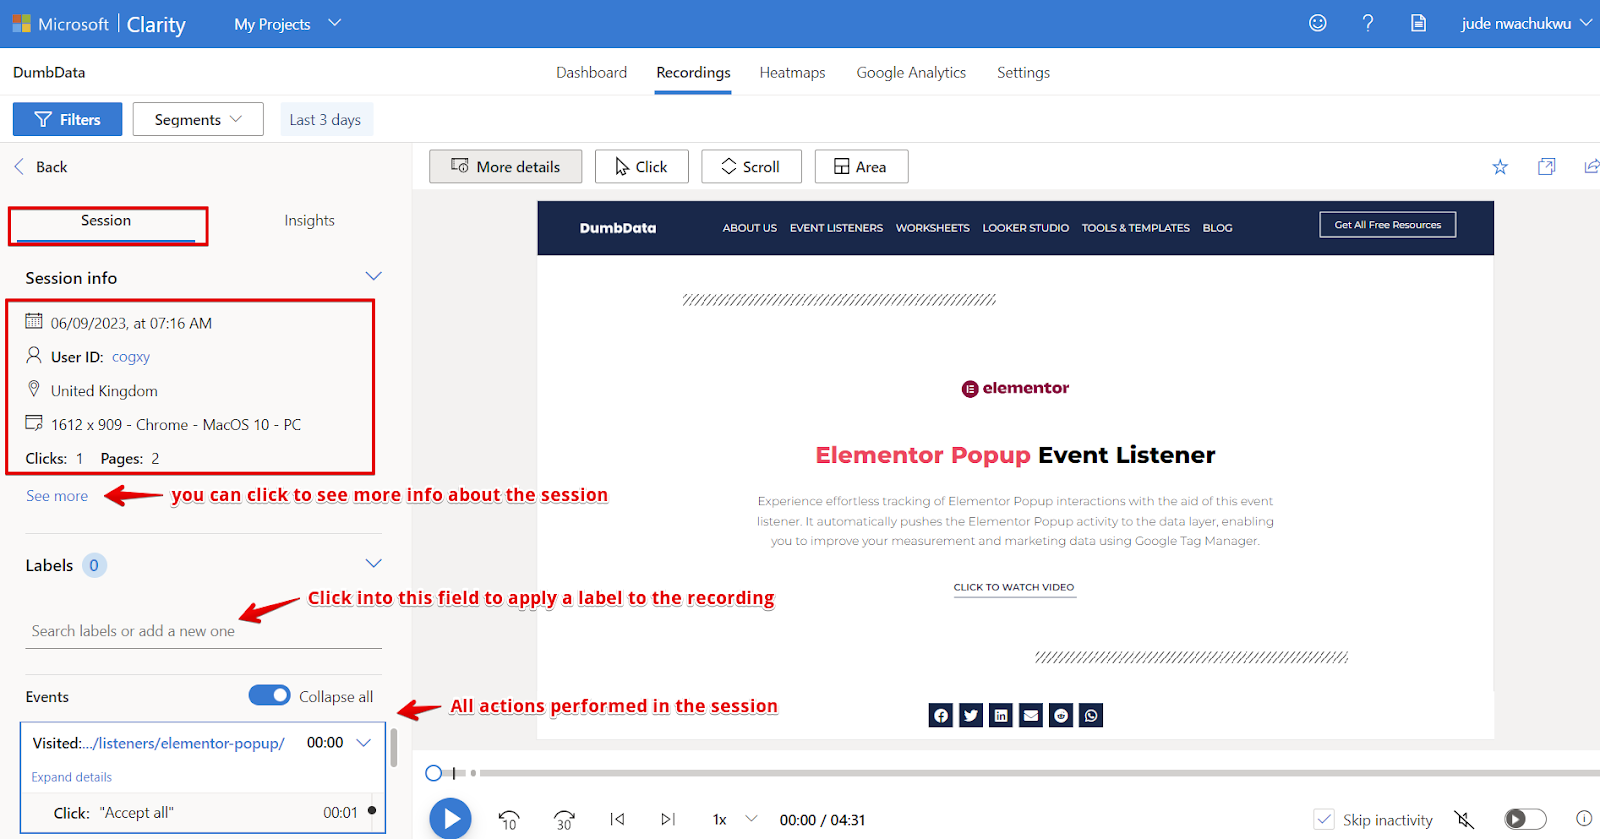
If you have “Co-Pilot” enabled, the “Insights” tab is a feature that utilises AI to assist you in summarising the session in an easily understandable format.

The “Click,” “Scroll,” and “Area” options at the top provide additional insights. You can mark a recording as a favourite by starring it, opening the webpage associated with the recording, and sharing it with others.
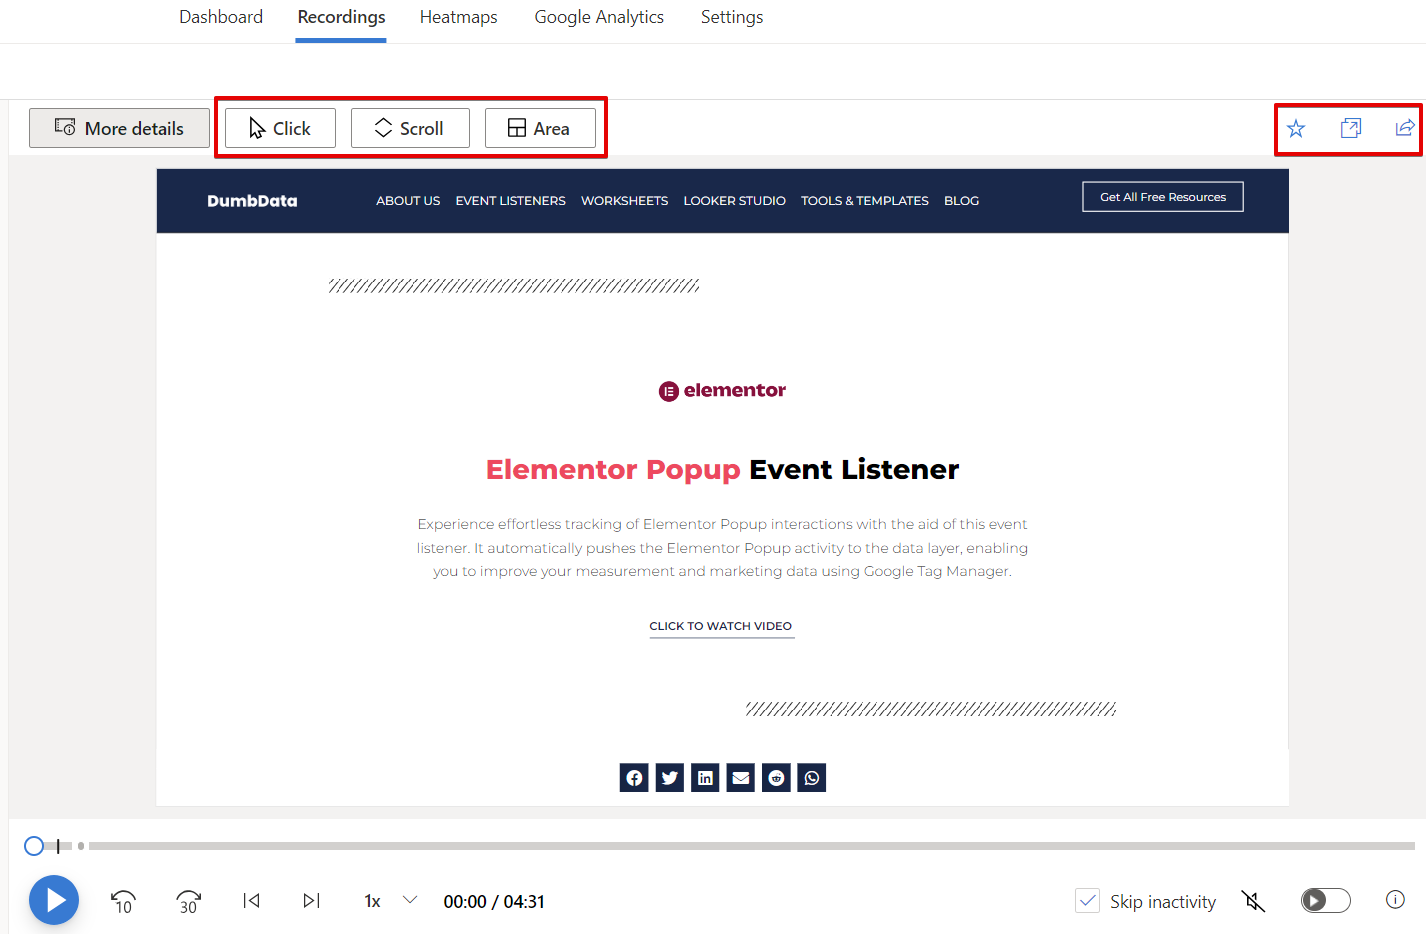
Session Recording Player Control:
The playback video offers several controls, allowing you to:
- Rewind by 10 seconds
- Fast forward by 30 seconds
- Play the next and previous videos
- Adjust the playback speed
- Skip inactivity
- Mute click sounds
- Turn on or off “Autoplay.“

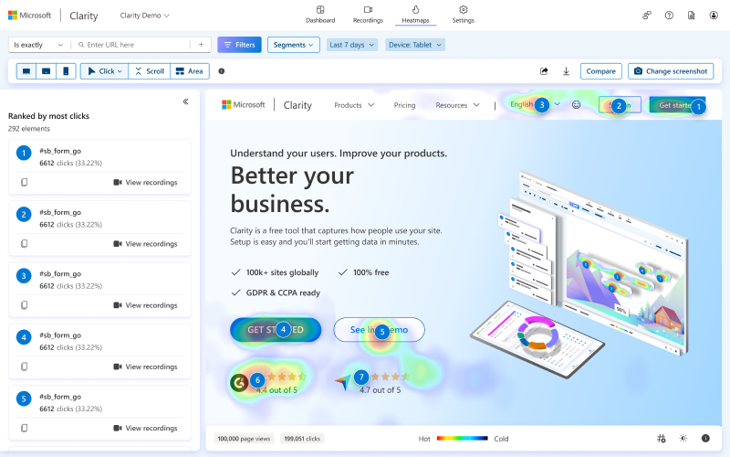
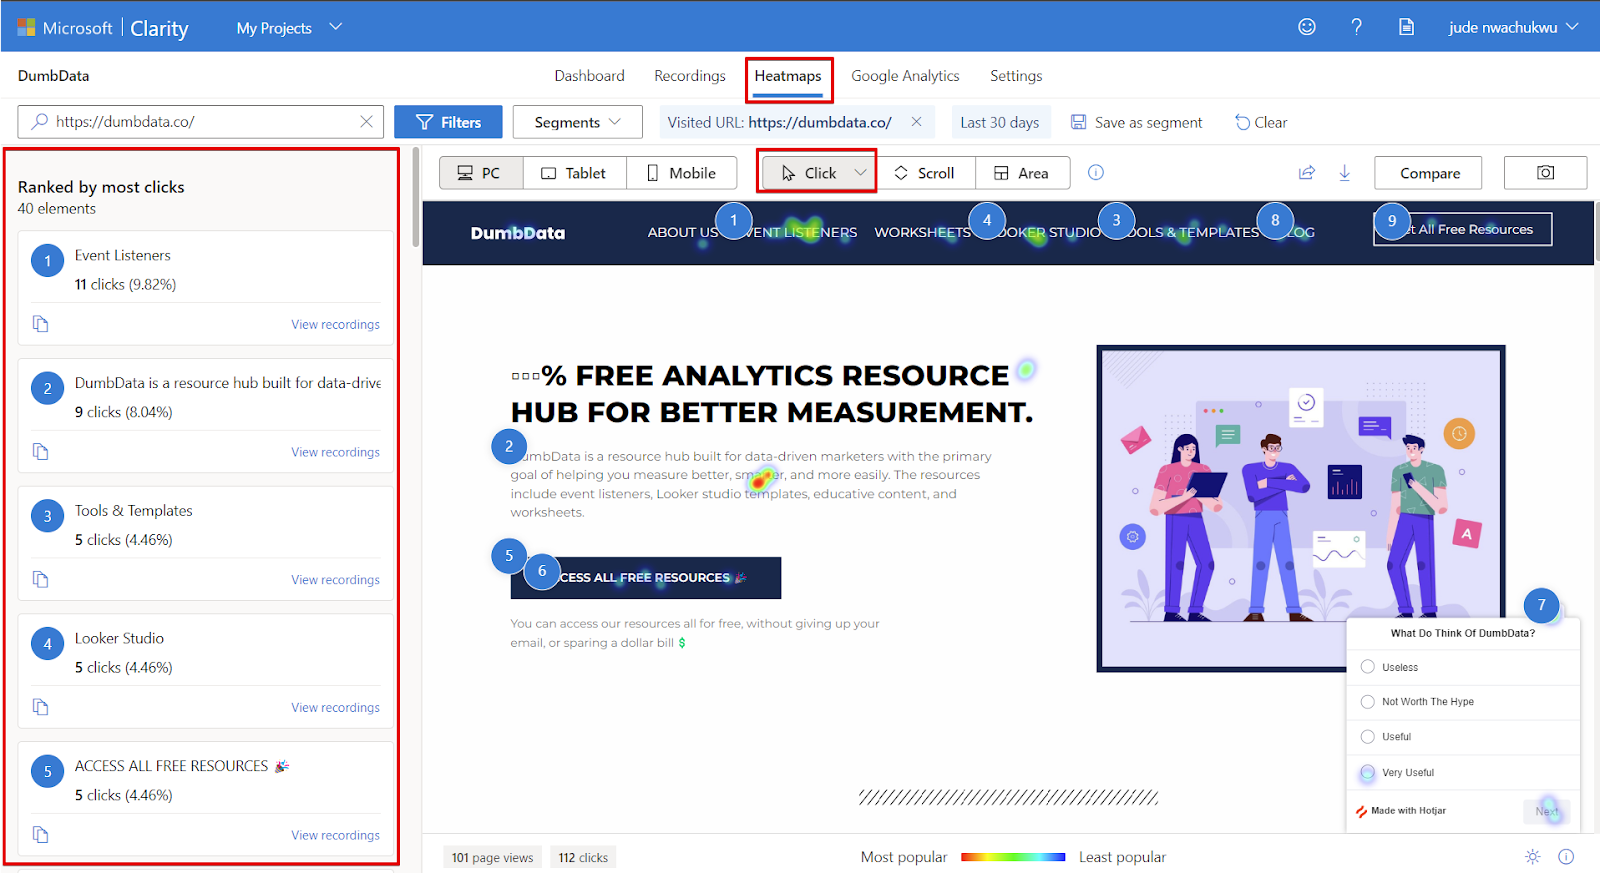
HeatMaps:
The HeatMaps report provides valuable insights into the engagement levels of different areas on your website. For example, it allows you to understand which parts of your page attract the most clicks and how far visitors scroll, revealing which sections capture attention and which remain unnoticed.
Upon visiting the HeatMaps report section, you will find a list of pages based on the filters or segments you have applied. In addition, the report displays the popular pages by default when no filters or segments are applied.
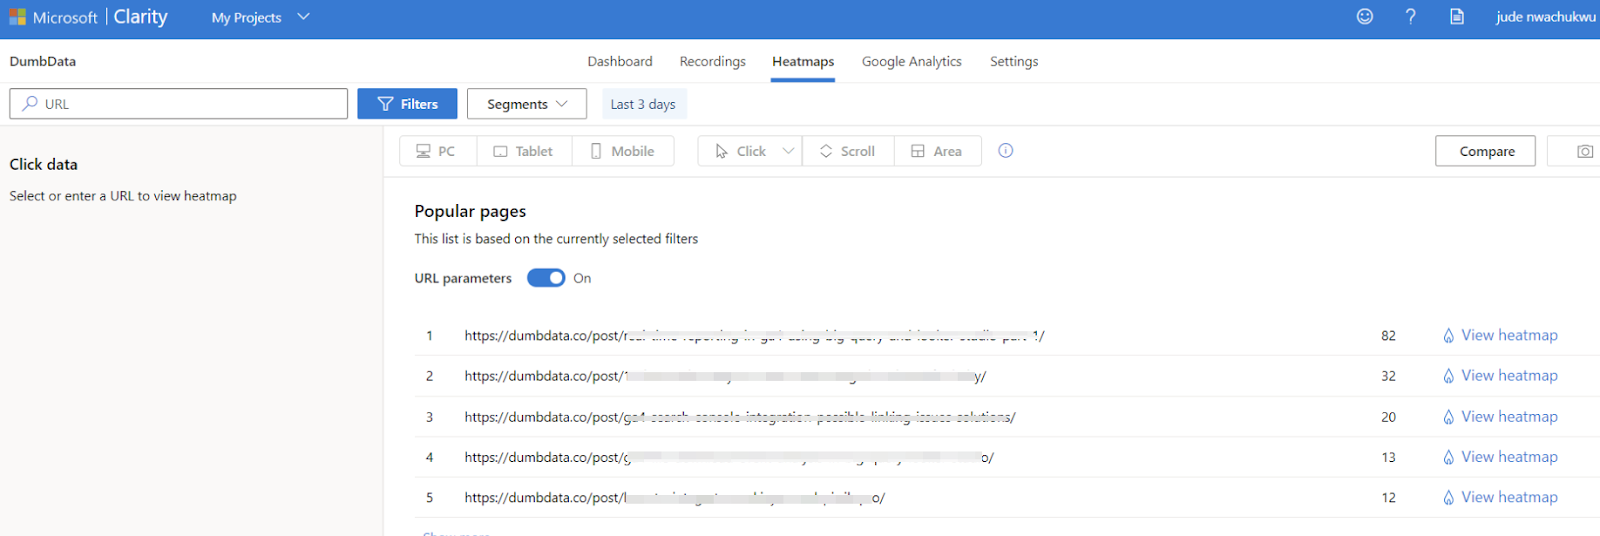
To explore the heat mapping data for a specific webpage, click either the webpage itself or the “View Heatmap” option. These heatmaps are generated instantly, so there is no waiting for them to get generated, as Clarity has been collecting the necessary data since the day of instrumentation and user interaction with that particular webpage.

When you access the heatmap, the default view shows the All Clicks heatmap for desktop devices. However, you can further refine the display by selecting a specific type of click heatmap.

Click the dropdown icon on the click tab to choose any of the following click types:

- All Clicks: This shows all types of user clicks on a page, including dead clicks, rage clicks, first clicks, and last clicks.
- Dead Clicks: Indicates where users clicked on a page without any effect or response.
- Rage Clicks: Reveals areas where users rapidly clicked in the same small area within a brief period.
- Error Clicks: Displays clicks that occur immediately before JavaScript errors.
- Clicks: Identifies the initial clicked element when a user arrives on that page in a session.
- Last Clicks: Identifies the final clicked element when a user arrives on that page in a session.
The Heatmap Top Panel:
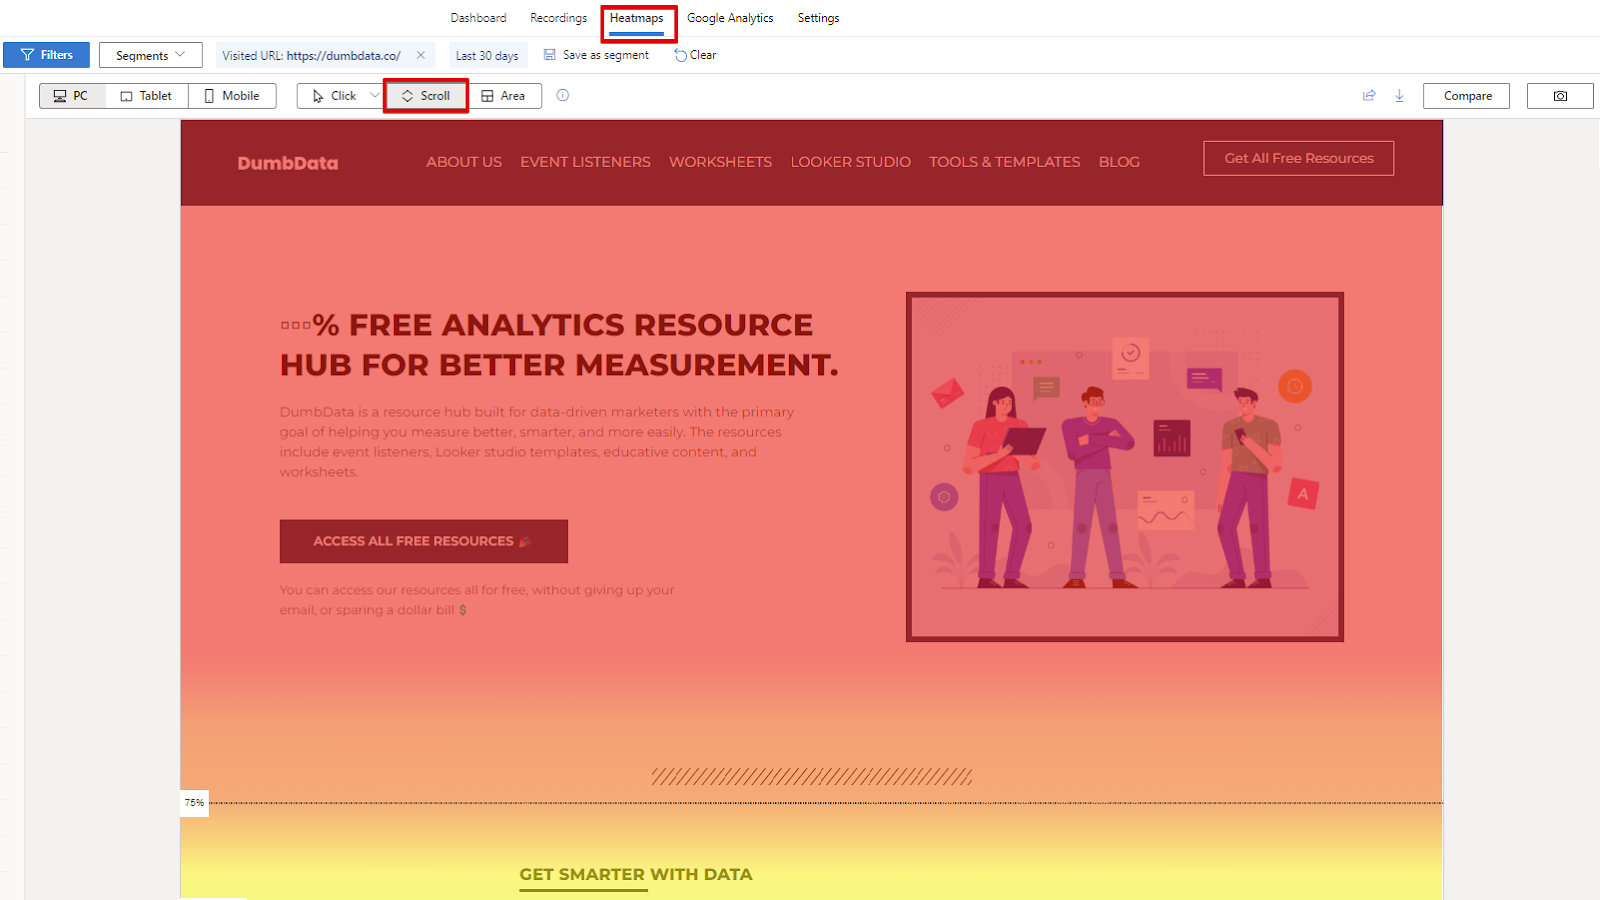
The top panel offers various configuration options. It presents you with the option to switch between different device categories (PC, Tablet, or Mobile) to view the heatmap for a specific device. Additionally, you can select the heatmap type, such as “Click,” “Scroll,” or “Area.”

- Scroll Map: Gives you insight into how far users scroll down the page.
- Area: Tells you the total clicks for all elements within a selected area or sections in a webpage.
Scroll Map:
Area Map:

In the top panel, you can also share the heatmap via email or as a link with individuals who have access to the project.
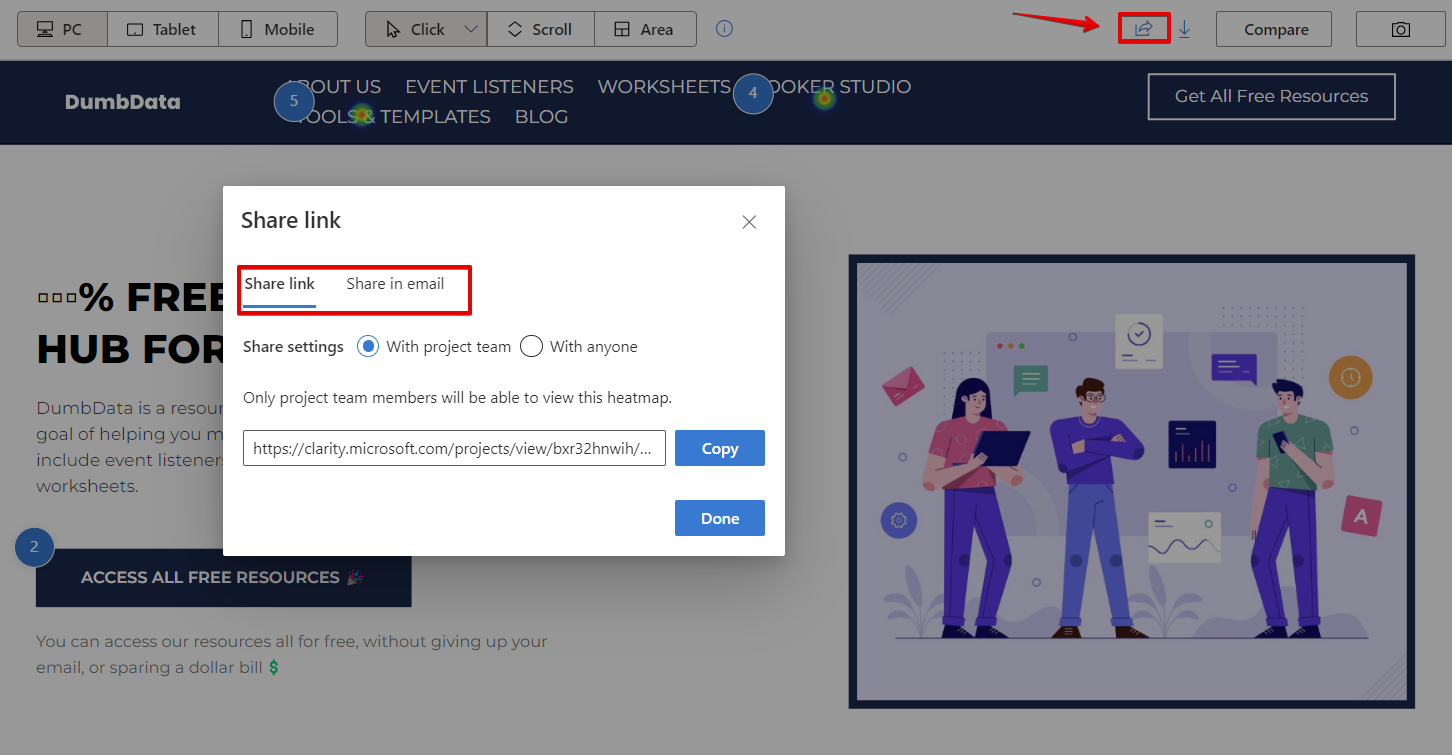
Furthermore, you have the option to download the heatmap as a CSV or PNG file.

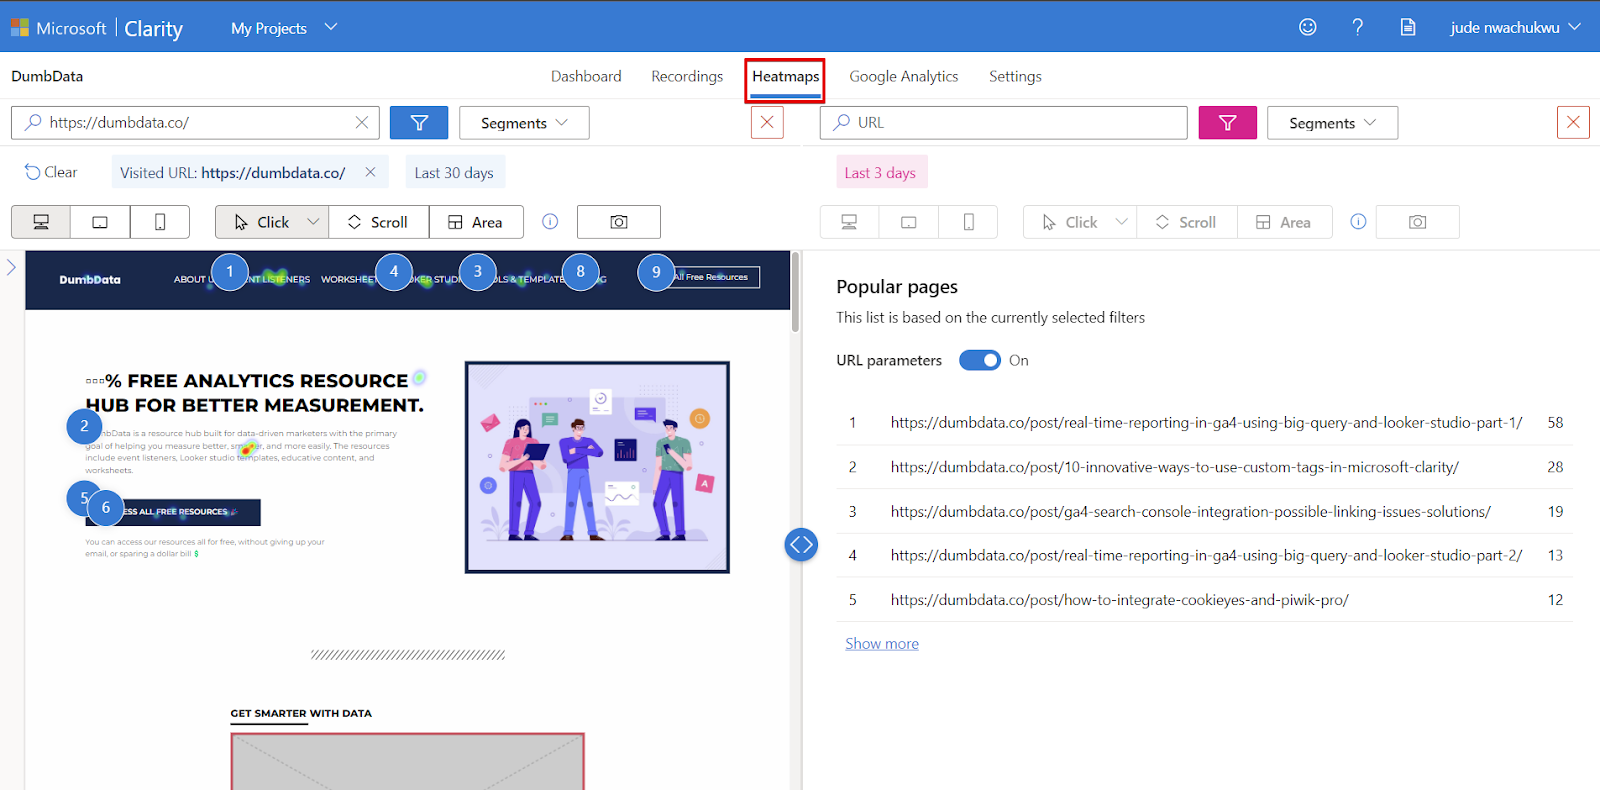
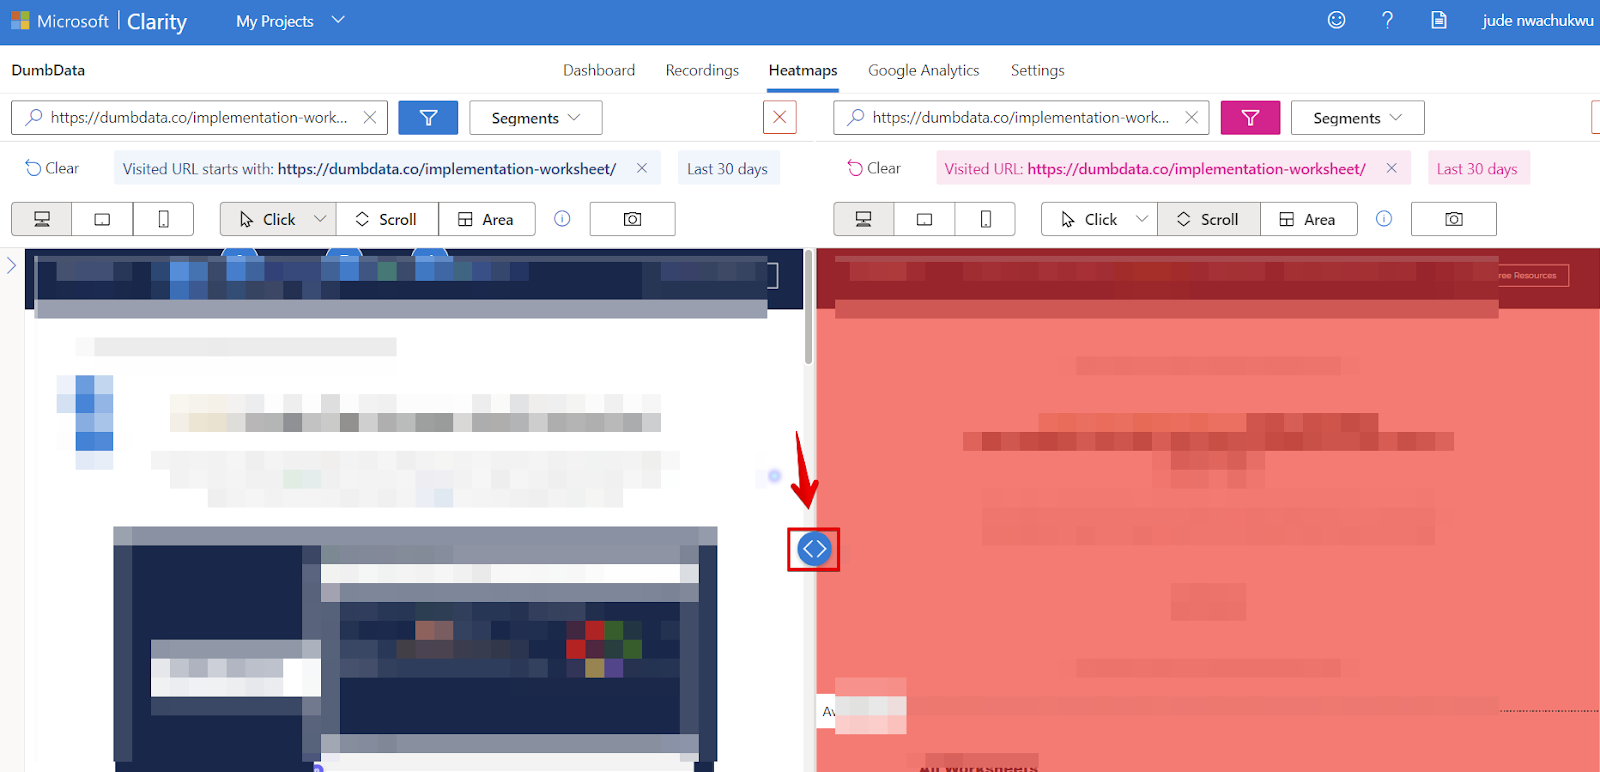
One remarkable feature of the heatmap report is the ability to compare two heatmaps. This feature lets you quickly identify areas where users click and scroll, understand how behaviour differs between user segments and time frames, apply filters, and track user journeys from page to page.
Click the “Compare” button to use this feature. Also, note it’s available on all heatmap types.

Configure your comparison by using either the URL filter or the filter option or by clicking the available list of pages you want to compare. Remember, you can use this feature with the different heatmap types.
Some of the ways to use the comparison feature.
Comparing heatmap of the same page but using a different date range to identify any difference in the user engagement with the web page.

You could also compare the same page but using a different filter; in the example below, I compared the same page. Still, on the second heatmap, I’m viewing the data for website visitors in the United States of America and can see differences in the click pattern.

Compare two different pages or track user behaviour as they move down the website funnel.

Compare clicks and scrolls of the same or different webpage not just to see how they scroll down, but the elements they clicked.

The heatmap comparison report features a convenient comparison slider that allows you to adjust the real estate screen dedicated to different comparison segments. This slider empowers you to allocate more focus or screen space to specific areas of interest within the comparison.
Switch Heatmap State:
Microsoft Clarity includes a Heatmap feature that enables you to switch between different states of the webpage, providing the ability to view a heatmap for a specific website state. By clicking the “camera” icon, you‘ll have the option to select a different screenshot. The generated heat map will reflect the elements present in that particular state. Click data and area data will be updated accordingly. However, scroll data remains consistent across all screenshots.

The Heatmap Side Panel:
The Heatmap Side Panel varies based on the type of heatmap you are viewing in the report;
For Click Maps:
When viewing the click map type, you will see all clicked elements ranked by the number of clicks received. Additionally, you can view recordings for sessions where that specific element was clicked.
For Scroll Maps:
The scroll data is presented in a table format, showing the number of visitors who scrolled to each percentage interval (5%) and the percentage of total users who reached each scroll depth threshold.

For Area Maps:
You will see the number of areas and their order of appearance on the webpage. Additionally, the number of clicks each area received will be displayed.

The Heatmap Bottom Panel:
The bottom panel provides insightful information about the selected filters and date range. This panel includes:
- The number of page views
- The number of clicks based on the selected click type
- The colour scale
- The opacity configuration allows you to adjust the transparency of the heatmap.

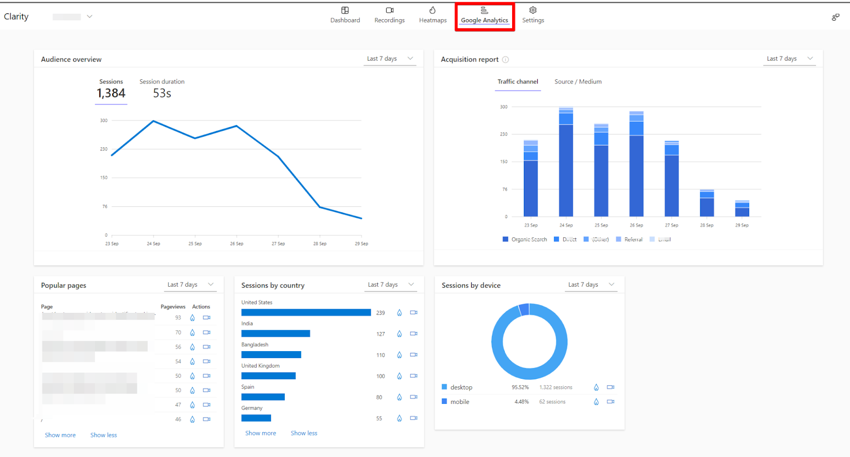
Google Analytics (If You Have Google Analytics Connected)
This dashboard provides useful visualisations and analysis of Google Analytics (GA4) data using Clarity features, including heatmaps and session recordings.
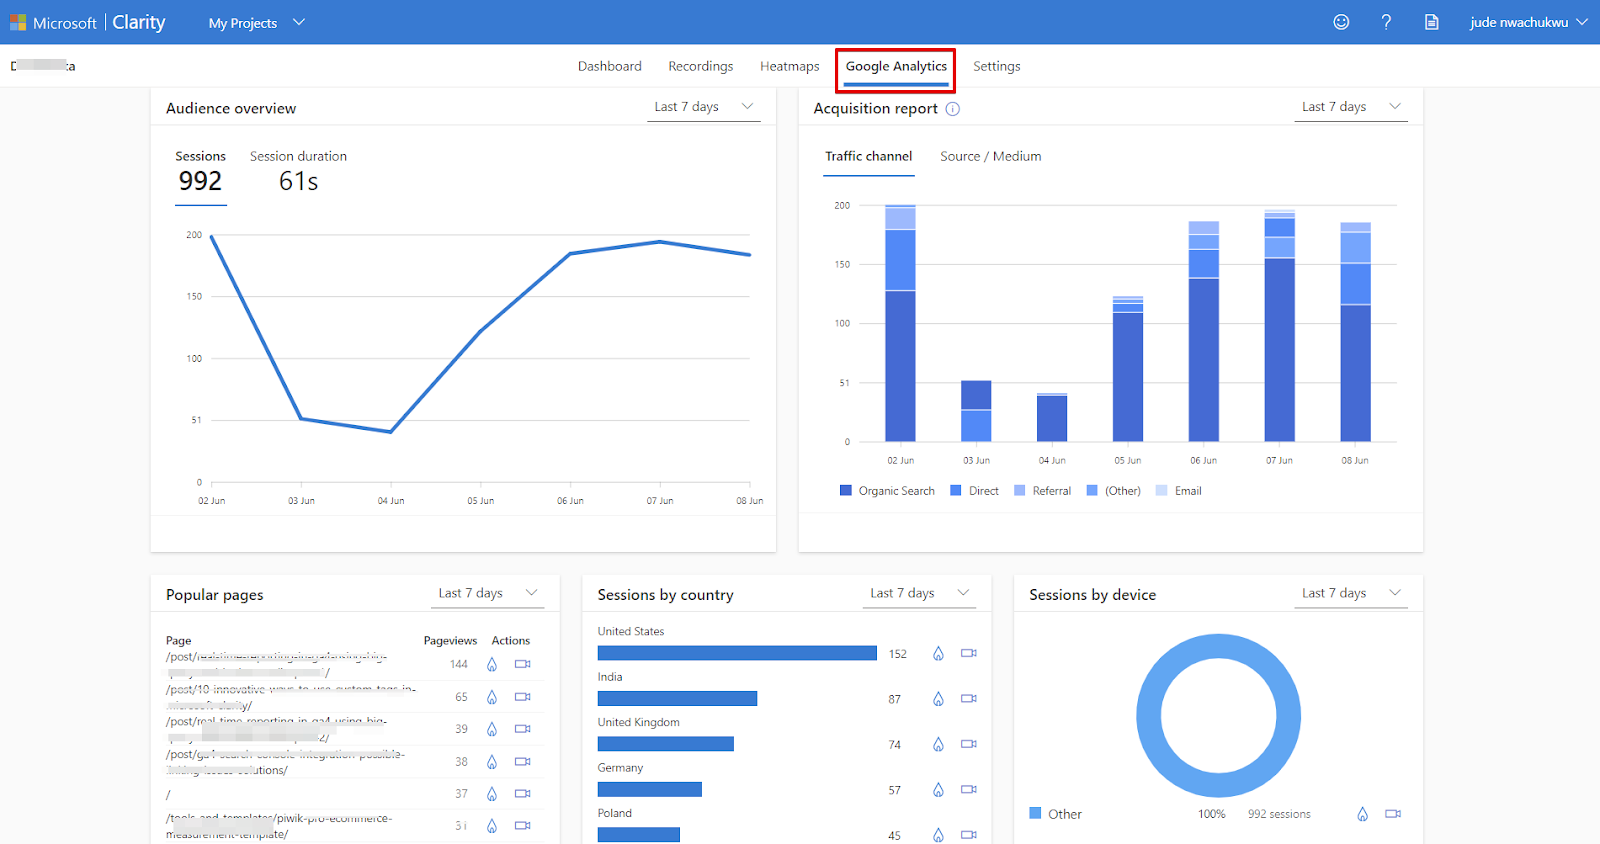
The report is divided into various sections:
- Audience Overview: Displays trends in Sessions and session durations.
- Acquisition Report: Provides insights into user acquisition.
- Page Performance by Views: Analyses the performance of pages based on views.
- Country Performance by Sessions: Examines the performance of different countries based on sessions.
- Device Performance by Sessions: Provides insights into device performance based on sessions.
What Are Custom Tags, and How Do They Enhance Analysis in Microsoft Clarity?
Clarity’s custom tags are configurable filters that empower you to analyse recordings and heatmaps from different perspectives. In addition, these tags can be easily created and shared across your team, allowing you to pass additional information through them.
Here are key points to note about custom tags in Clarity:
- Custom tags are not retroactive; they get applied to future data.
- You can have unlimited Microsoft Clarity custom tags in a project.
- Custom tags are applied after the Clarity tracking script has loaded on the page.
- The custom tag’s name and value cannot exceed 255 characters.
- A single page can have up to 128 tags, with any additional tags being ignored.
- Custom tags can consist of alphanumeric values.
The code snippet below is what you’ll have to use to apply a custom tag:
clarity("set", "key", "value");– Key: Specifies the name of the tag.
– Value: Defines the value the tag should have upon application.
You can utilise Microsoft Clarity’s Custom Tags in various ways, such as tagging sessions where conversions occurred, pushing page titles to Microsoft Clarity to identify sessions with 404 errors, content grouping, and more. For further inspiration, refer to the article outlining the ten (10) innovative ways to utilise Microsoft Clarity custom tags.
Using the Luratic template, you can easily add a new tag by selecting the Luratic Microsoft Clarity tag type and inputting your custom tags before saving the GTM tag.
The example of the setup below is used to capture the page title and content group and have them applied as custom tags in Microsoft Clarity, which can later be used for data segmentation when performing analysis in the tool.

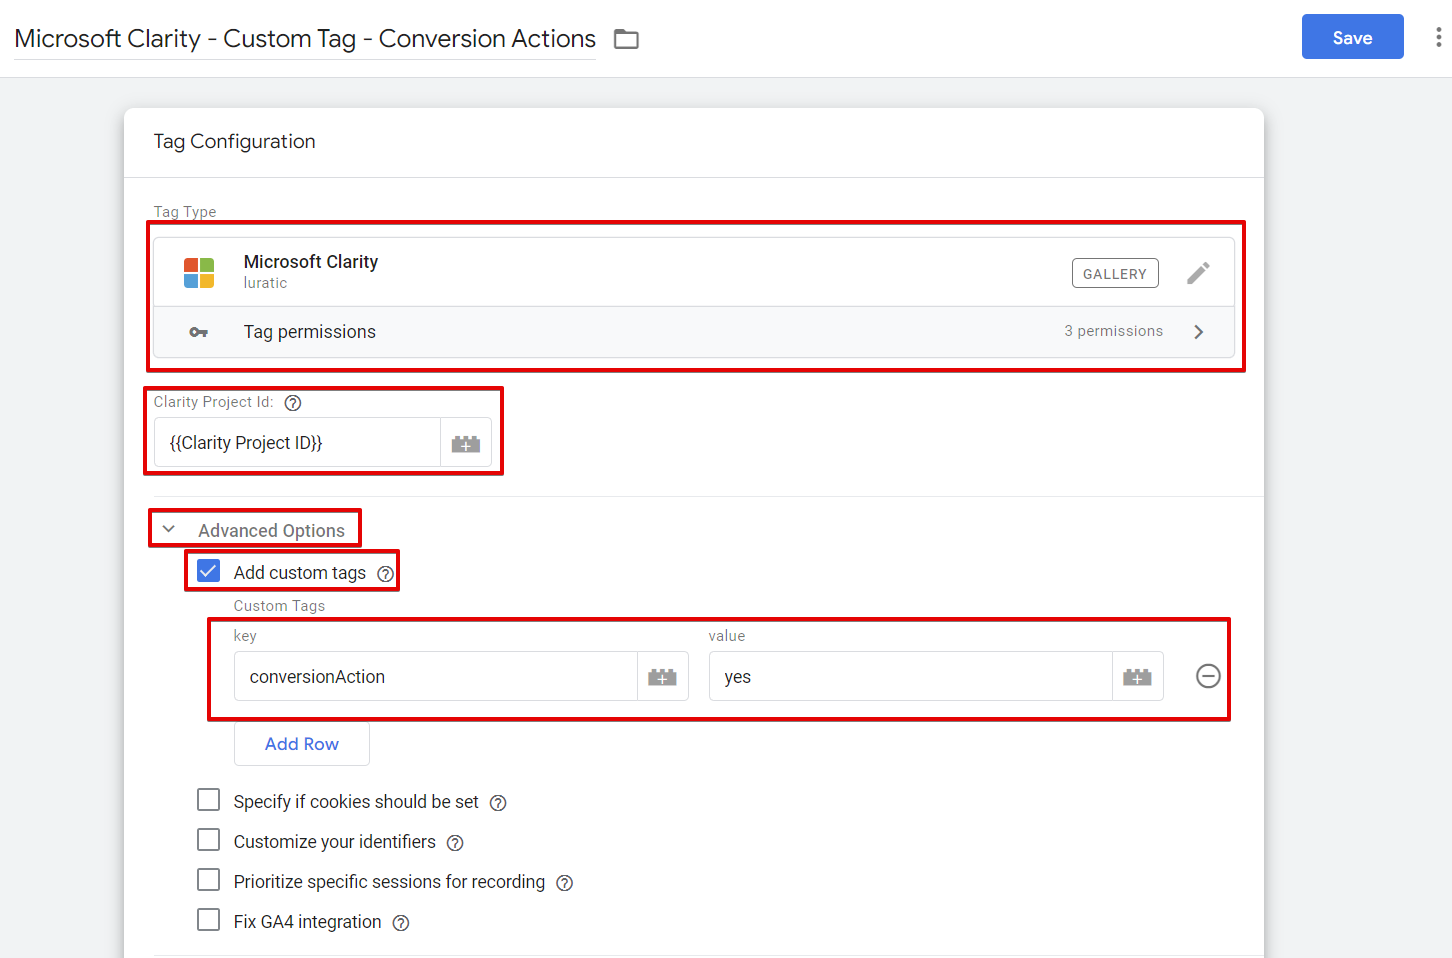
Here is an example setup where the custom tag is applied when a user performs conversion actions.
Alternatively, If you are using the custom HTML tag type or the Microsoft native custom tag type, you need to use the custom HTML tag type to apply custom tags.
<script type="text/javascript">
clarity("set", "pageType", "{{your content group}}");
clarity("set", "pageTitle", "{{your page title variable}}");
</script>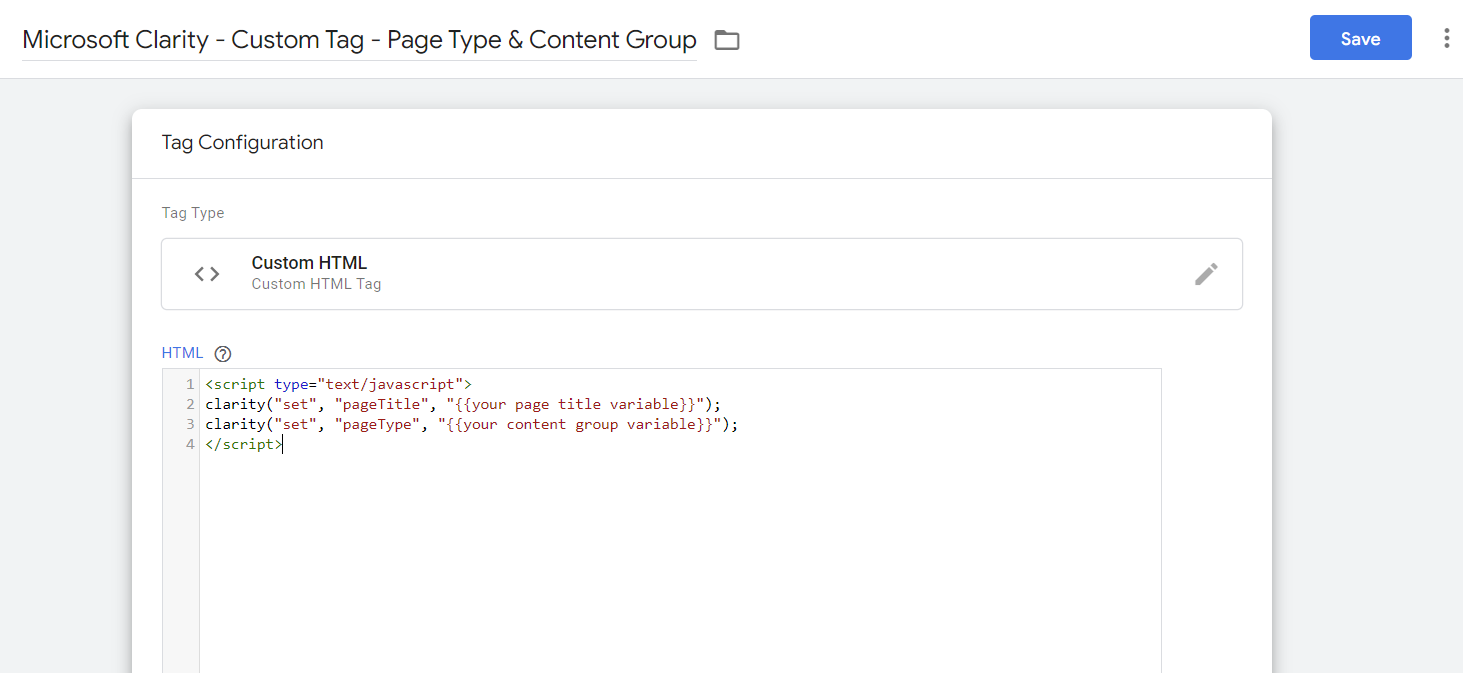
Here is another example of custom tags that can be used for tracking conversions.
<script type="text/javascript">
clarity("set", "conversionAction", "yes");
</script>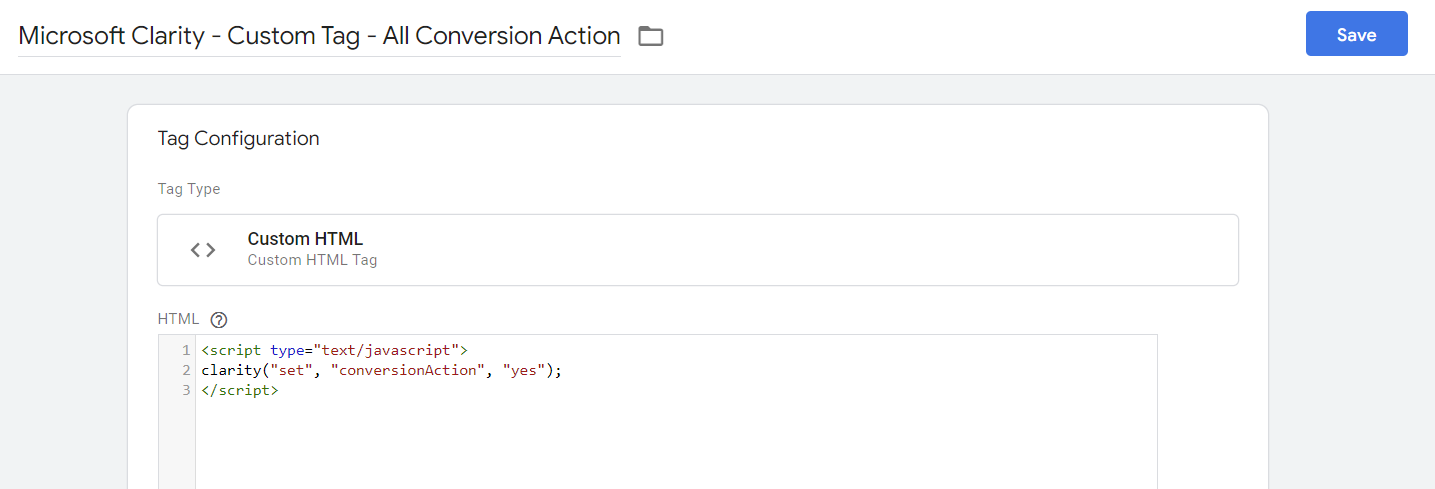
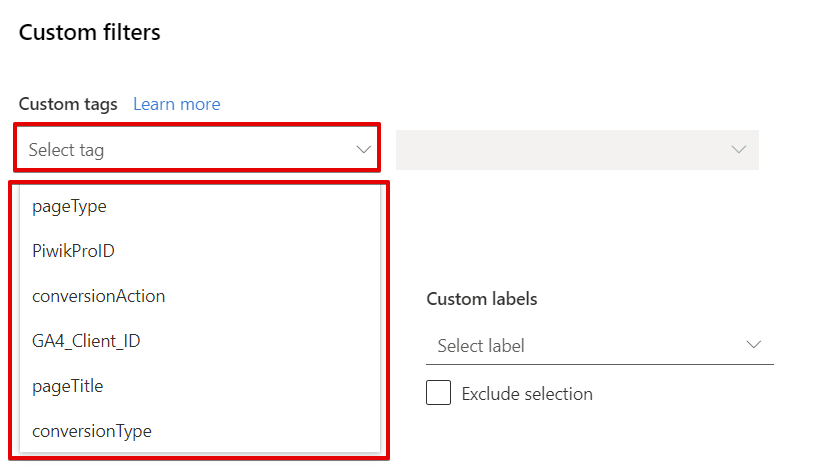
After you’ve created and applied “Custom Tags”, you can use them in the session filter by following these easy steps:
- Open the filters modal popup.
- Click or scroll to the “Custom Filters” section.
- Select your custom tags and specify the values to be included or excluded in your segment.

When you click into the “Custom Tags” dropdown field to select a tag, you’ll be presented with the custom tags that have been applied for the date range to which you currently have the data filter.
Customisation of IDs in Microsoft Clarity
This feature is valuable for websites with a login system or means of identifying visitors. Like other tools, you can send your store or website ID to Microsoft Clarity. Additionally, you can send individual web page IDs and a custom session ID using the Microsoft Clarity API. Do not be intimidated by the term “API.”
Below are examples of JavaScript code used to customise your Microsoft Clarity identifiers.
window.clarity("identify", "custom-userID", "custom-sessionId", "custom-PageId", "Friendly-Name")

// sample of the code in action for a user with emaill address of janedoe@human.io or user id of janedoehuman23
window.clarity("identify", "janedoehuman23", "csi-456023", "collection page", "Jane")
The following parameters need to be included when using custom identifiers;
- userID (required in all identify API calls)
- sessionID (optional)
- PageID (optional)
- Friendly-Name (optional)
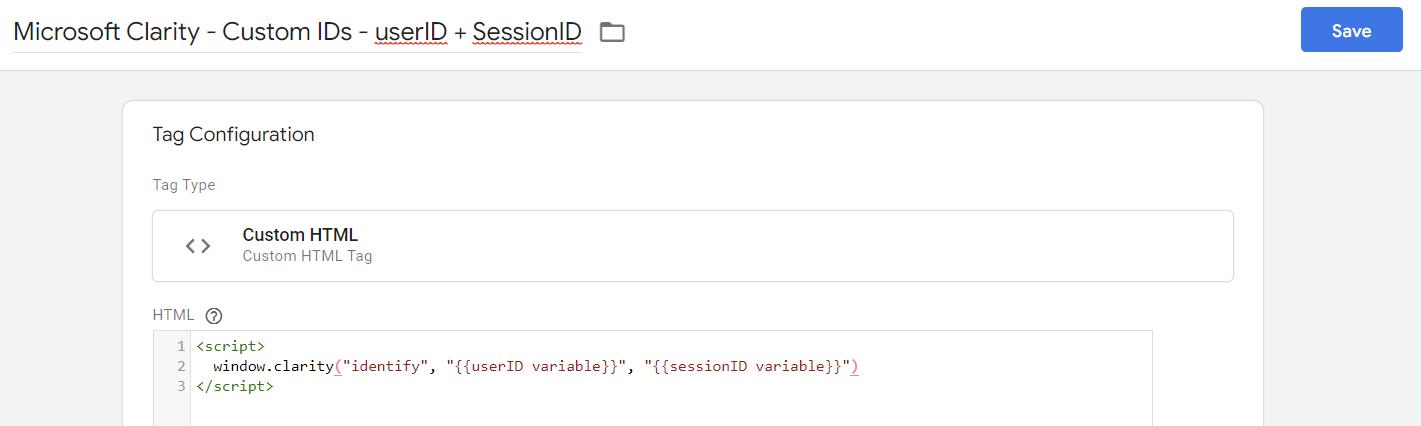
You can utilise the Custom HTML tag type or the Luratic Microsoft Clarity tag template to achieve this customisation.
For the Luratic Microsoft Clarity template user, create a tag and add the necessary variables to each field where you want to collect data.

Alternatively, if your instrumentation was accomplished using the custom HTML tag, Microsoft Native Clarity tag type, or any instrumentation method with Google Tag Manager.
You can use the custom HTML tag type and choose from the following code examples to customise the required identifiers.
The setup is for instances where you’re only tracking the userID.
<script>
  window.clarity("identify", "{{userID variable}}")
</script>

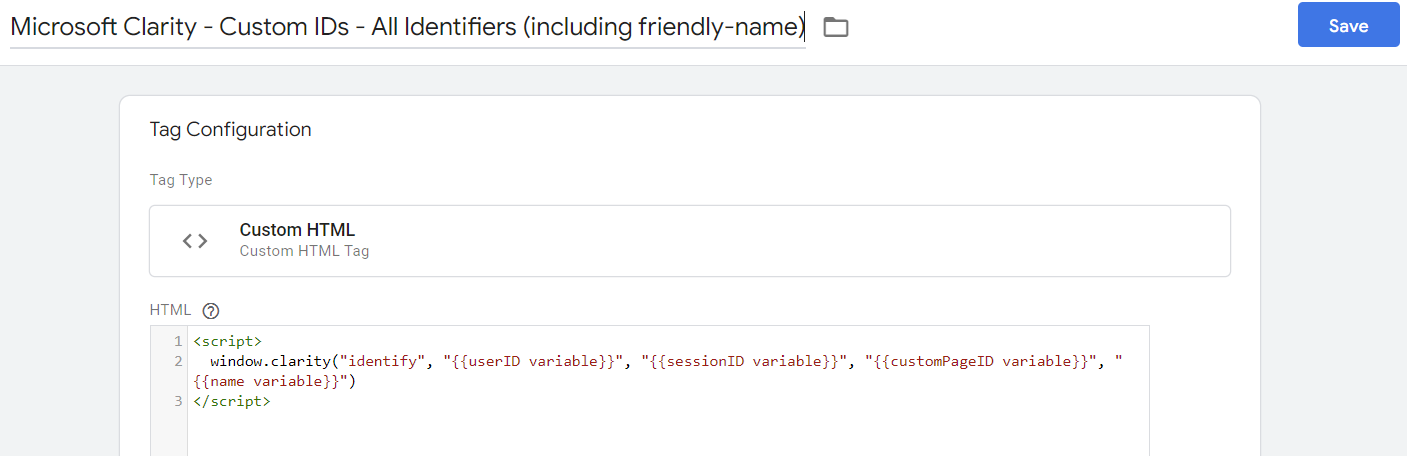
The setup below has all the identifier parameters, including the “friendly-name” parameter.
<script>
  window.clarity("identify", "{{userID variable}}", "{{sessionID variable}}", "{{customPageID variable}}", "{{name variable}}")
</script>
While the setup below has all the identifier parameters, excluding the “friendly-name” parameter.
<script>
  window.clarity("identify", "{{userID variable}}", "{{sessionID variable}}", "{{customPageID variable}}")
</script>
You should have a similar setup if you intend to have userID and sessionId tracking using the Microsoft Clarity custom identifier feature.
<script>
  window.clarity("identify", "{{userID variable}}", "{{sessionID variable}}")
</script>
While for a scenario where you intend to track userID and pageID, you’ll have to label the sessionID as undefined using the Google Tag Manager undefined variable.
<script>
  window.clarity("identify", "{{userID variable}}", {{Undefined Value}}, "{{custom pageID variable}}")
</script>
For instances where you intend to track the user using their userID, with the “friendly-name” parameter included, you should end up with a setup like the one below.
<script>
  window.clarity("identify", "{{userID variable}}", {{Undefined Value}}, {{Undefined Value}}, "{{username}}")
</script>

A few things to note about Identifier Customization
- Microsoft Clarity ensures secure hashing of the custom ID on the client side before transmitting it to Clarity servers.
- To achieve optimal user tracking with the userID, it is recommended to call the Identify API for each page of the website, even if you are not passing a custom session ID or custom page ID.
- The userID is required as a parameter when using the Identify API to collect custom identifiers.
- To efficiently track the user using identifiers, Identify API should only be used for authenticated users, not guest users.
- Within the identifier parameter dimensions of Microsoft Clarity, you have the option to send an email address as the userID and utilise either the “friendly-name” or “userHint” as the user name. Acknowledging that these pieces of information are considered personally identifiable information (PII) is essential. Although Microsoft Clarity hashes the user ID for added security, it is crucial that you exercise due diligence to ensure compliance with user privacy regulations applicable to your business entity and avoid any potential violations.
Using Custom Identifiers In Microsoft Clarity
Once you have implemented custom identifiers, you can utilise them to create filters that can be saved as segments for future use. To access these filters, simply click the “Filters” button to open the filters panel.

From there, navigate to the “custom filters” section or select the “custom filters” option from the side listing. In this section, you will find the option to filter by userID, pageID, and sessionID. It is important to note that you need to know the specific IDs you have been tracking in your project before applying the filters, as Microsoft Clarity does not display the IDs within the platform.

E-commerce Tracking & Reporting With Microsoft Clarity
Microsoft Clarity offers some support for e-commerce tracking, although it may not be as extensive or sophisticated as what you’re accustomed to in Google Analytics. However, setting it up is as easy as ABC.
Let’s explore what you can expect from e-commerce reporting in Microsoft Clarity and how to enable it.
Product Reporting:
E-commerce stores using Microsoft Clarity will have an additional card on their insight dashboard dedicated to product views. This card provides information on which products are receiving more views. In addition, you have the option to watch session recordings of the sessions where the product was viewed or view a heatmap of the product page.

To enable this data in Microsoft Clarity, you need to have either the GA4 e-commerce dataLayer or a product JSON.LD. If you have the GA4 e-commerce dataLayer, the product view data will automatically appear on the card along with a set of new filters, including Name, Price, Brand, Availability, Average Rating, and Number of Ratings.
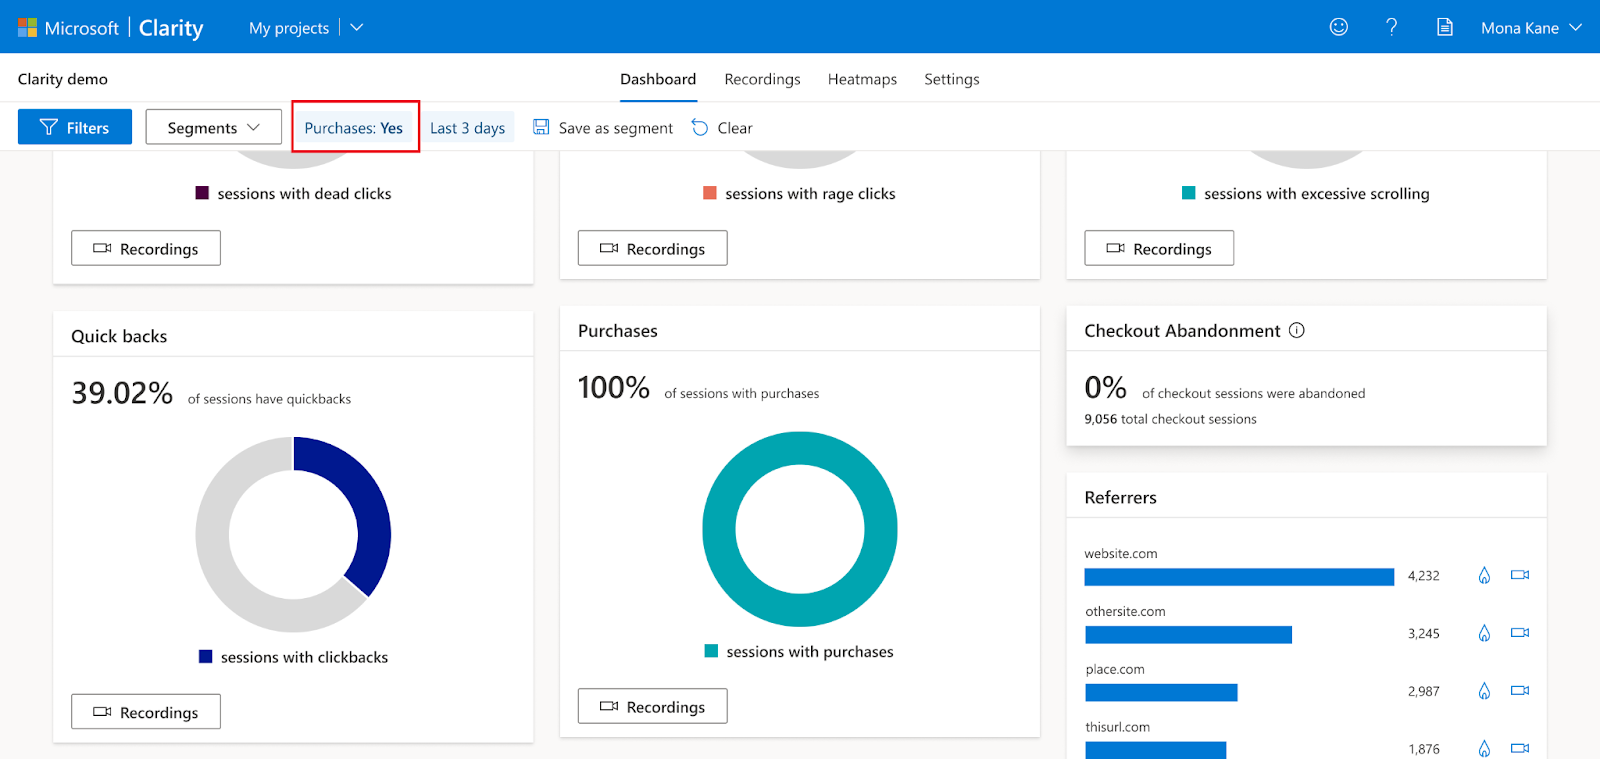
Purchase Reporting:
If you’re not using Shopify, you won’t see a card displaying the percentage of sessions with completed purchases in your dashboard.

However, with this same feature, you can still watch session recordings of sessions that a user didn’t purchase using the filter exclusion feature. Additionally, a new filter called “Purchase” with a value of “Yes” is available.
If you’re using Elevar (a must-have for any Shopify store) or the native Shopify integration, you will automatically receive this data without any extra setup.
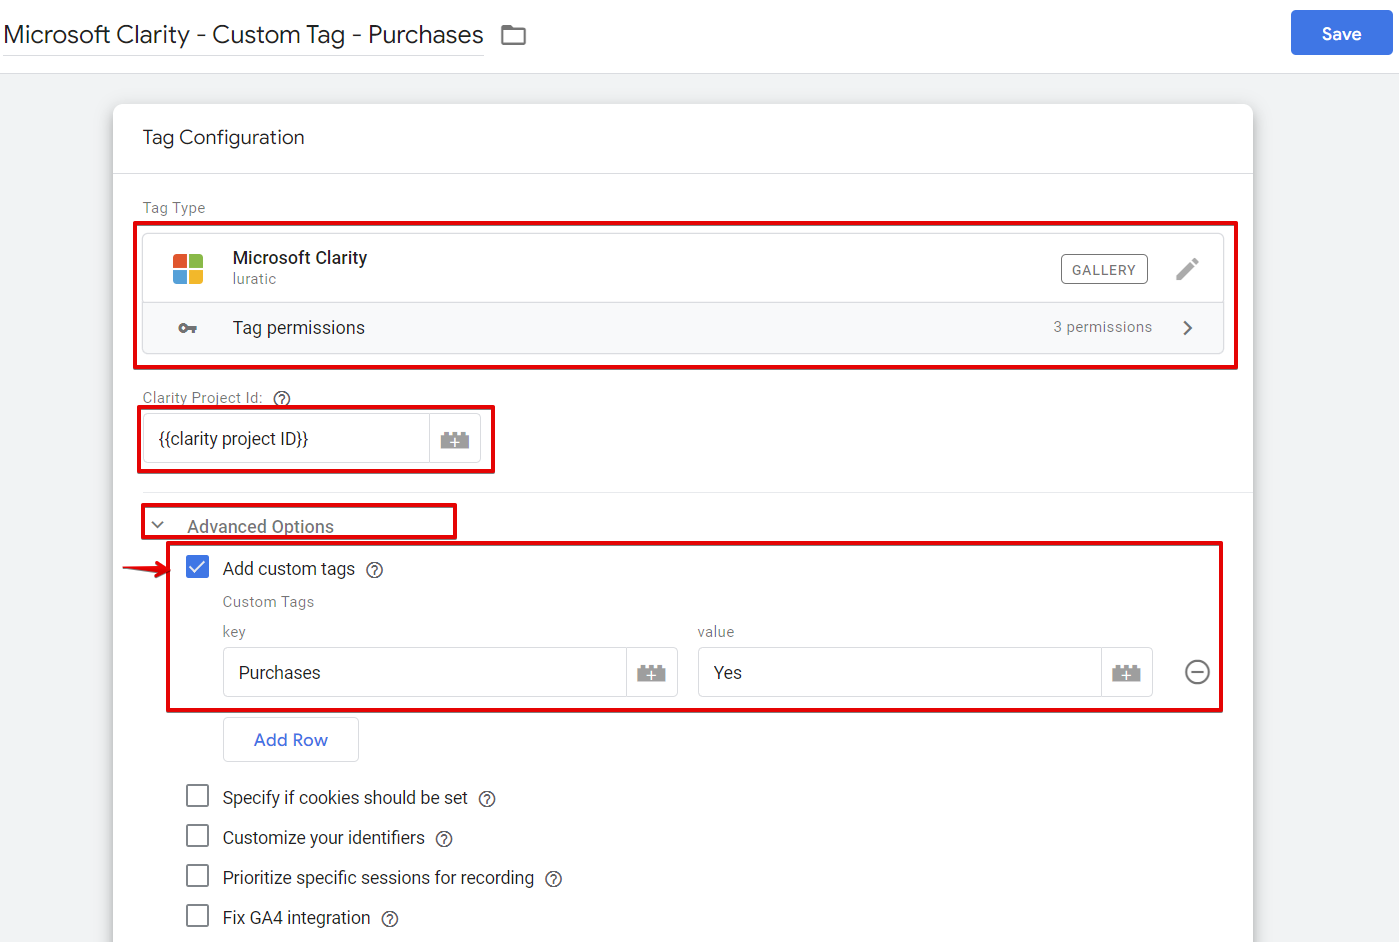
For non-Shopify users, don’t worry, as there is a workaround. Although you won’t have the “Purchases card” displayed in your Microsoft Clarity insight dashboard, you can still filter by users who made a purchase or not. You can achieve this using a “Custom Tag” where the key is “Purchases” and the value is a constant “Yes“.
If you intend to use the custom HTML tag type, you’ll end up with a setup like the one shown in the image below.
<script type="text/javascript">
clarity("set", "Purchases", "Yes");
</script>
If you’re using the Luratic tag template, your setup should be similar to the one in the image.
Checkout Abandonment Reporting:
This feature is exclusively available for Shopify Plus stores. With this integration, a “Checkout Abandonment” card will be automatically displayed on your Microsoft Clarity insight dashboard. It allows you to identify at which stage of the checkout funnel your website visitors are dropping off. In addition, you can choose to watch session recordings or view heatmap data for these sessions.

Integrating Microsoft Clarity with Other Stacks
One of the most exciting things I love about any analytics tool is the ability to integrate them with the tools you’re already using. This part of the blog post explores how Microsoft Clarity seamlessly integrate with your already familiar stacks.
Also, We’ll discuss integrating with third-party stacks where a native connection isn’t available yet, as well as some issues related to the native GA4 integration and how to address them.
Integrations are crucial in enhancing the data you collect and deriving value from a product. Microsoft Clarity natively connects with various tools you’re accustomed to already. This integration enables seamless data sharing, makes discovering new insights possible, and enhances your overall instrumentation.
However, it is also possible to establish manual integrations between Clarity and other marketing and measurement tools your business utilises.
Issues with the Native Integration of Google Analytics (GA4) and Microsoft Clarity Integration
While the native integration between Google Analytics (GA4) and Microsoft Clarity is beneficial, it should be complemented with manual integration between both tools. However, there are some issues associated with natively integrating both tools.
Unlike Universal Analytics, the integration does not utilise a session scope custom dimension, which means the session recording playback URL is only available for the “Clarity” event, but not for other events such as 404 errors, conversion events, or sessions with funnel abandonments.
For example, the image below shows that the session recording is only available for the “Clarity” event, while it returns “(not set)” for other events.
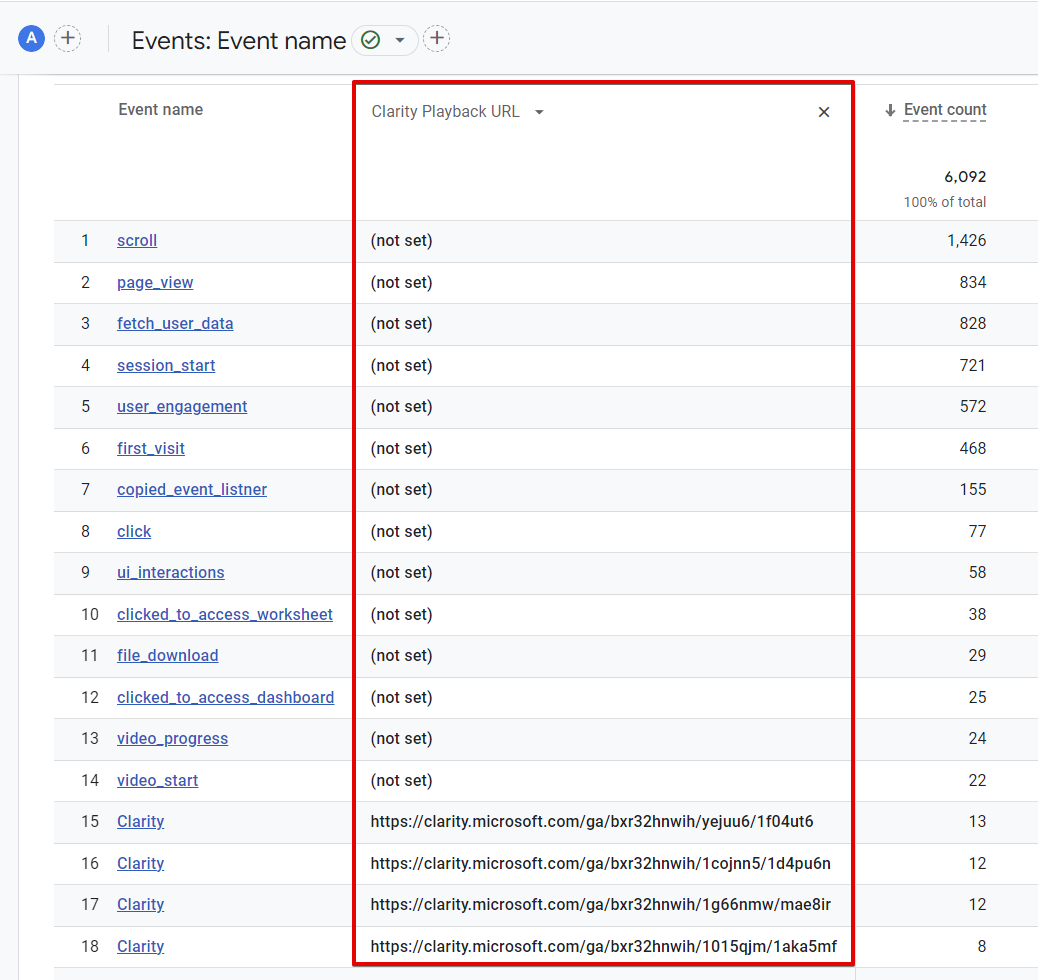
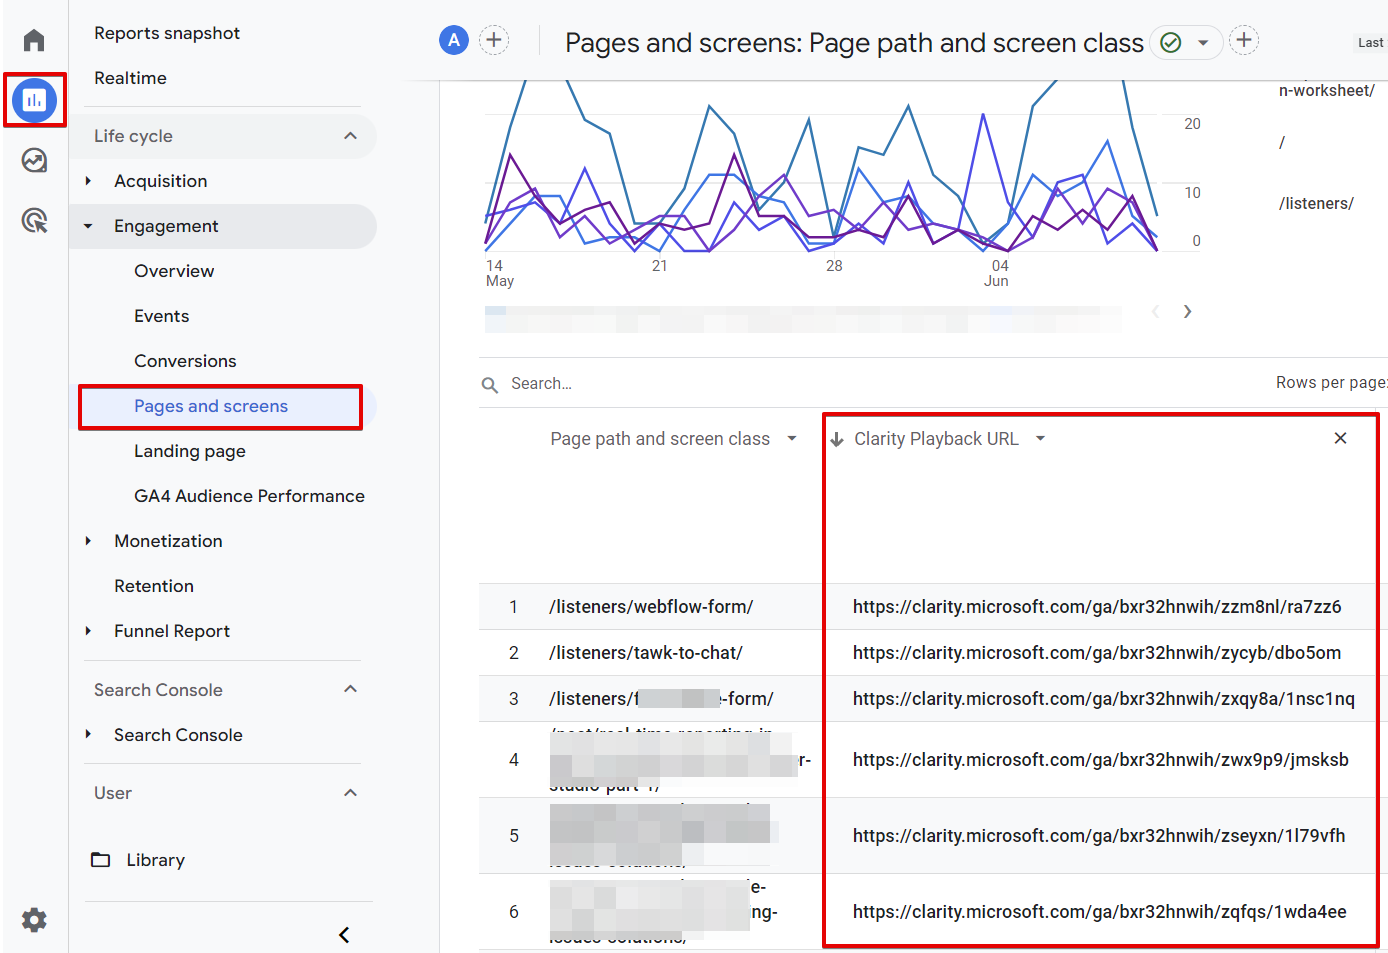
Although you may see the session recording in the “Pages and Screens” standard report, as shown in the image below. (that is when you sort by the “claritydimension,” custom dimension)
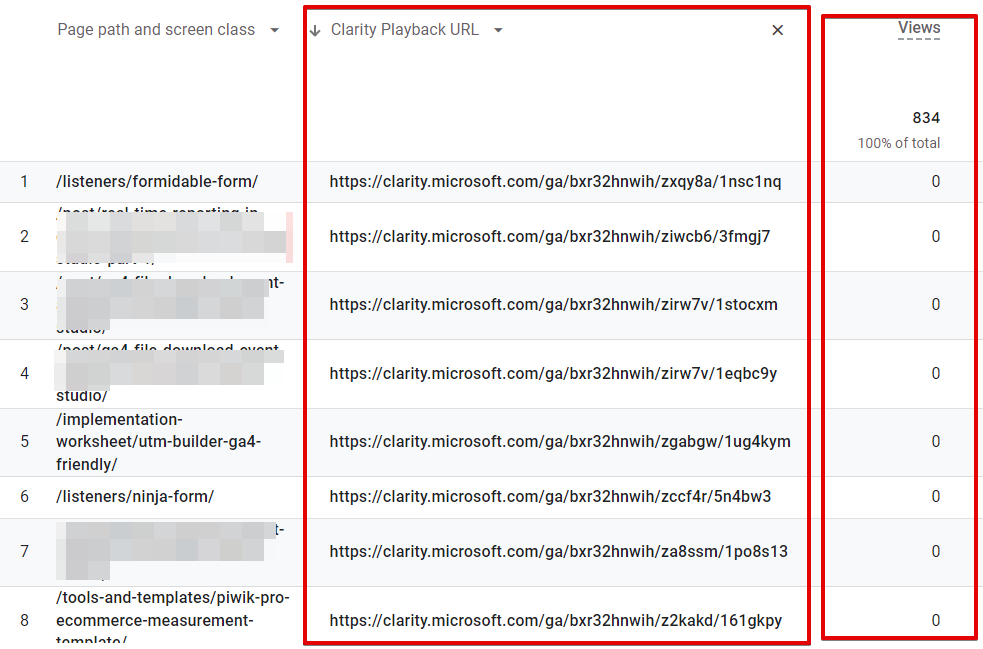
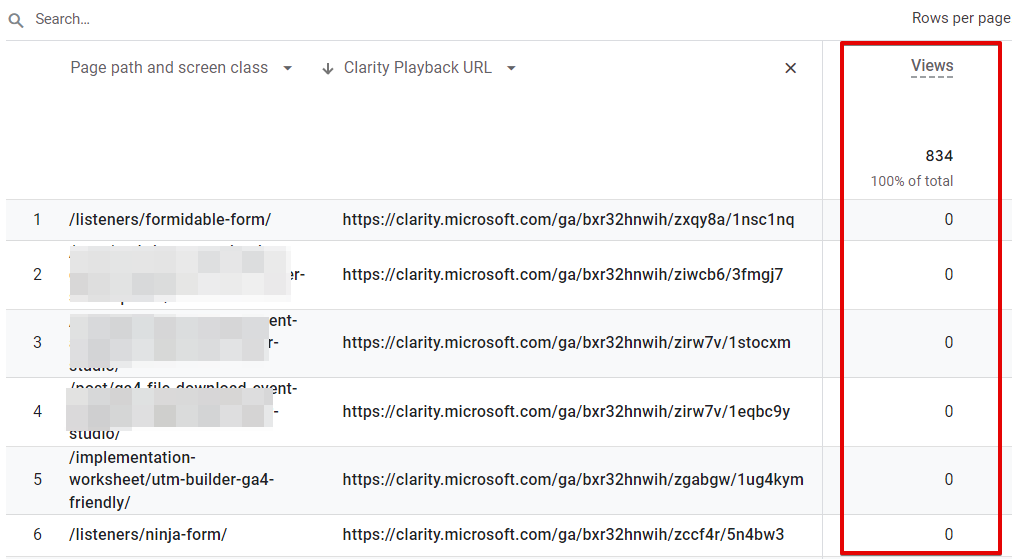
Without sorting by “Clarity Playback URL” custom dimension, you get “(not set)” in the clarity URL playback column.

It’s essential to note that these pages with a session recording URL are where the “Clarity” GA4 event was recorded. The GA4 event “Clarity” passes an additional parameter called “claritydimension,” which contains the Microsoft Clarity session recording playback URL. This explains why “views” and other events are reported as zero in the images below.
Another issue with the native integration concerns privacy compliance, specifically with regulations such as GDPR and DPA. For example, Microsoft Clarity can be classified under the performance or analytics consent category, while GA4 is considered part of the analytics and marketing category.
It means that Microsoft Clarity will trigger the GA4 event even when the consent required to fire the GA4 tag has not been granted.
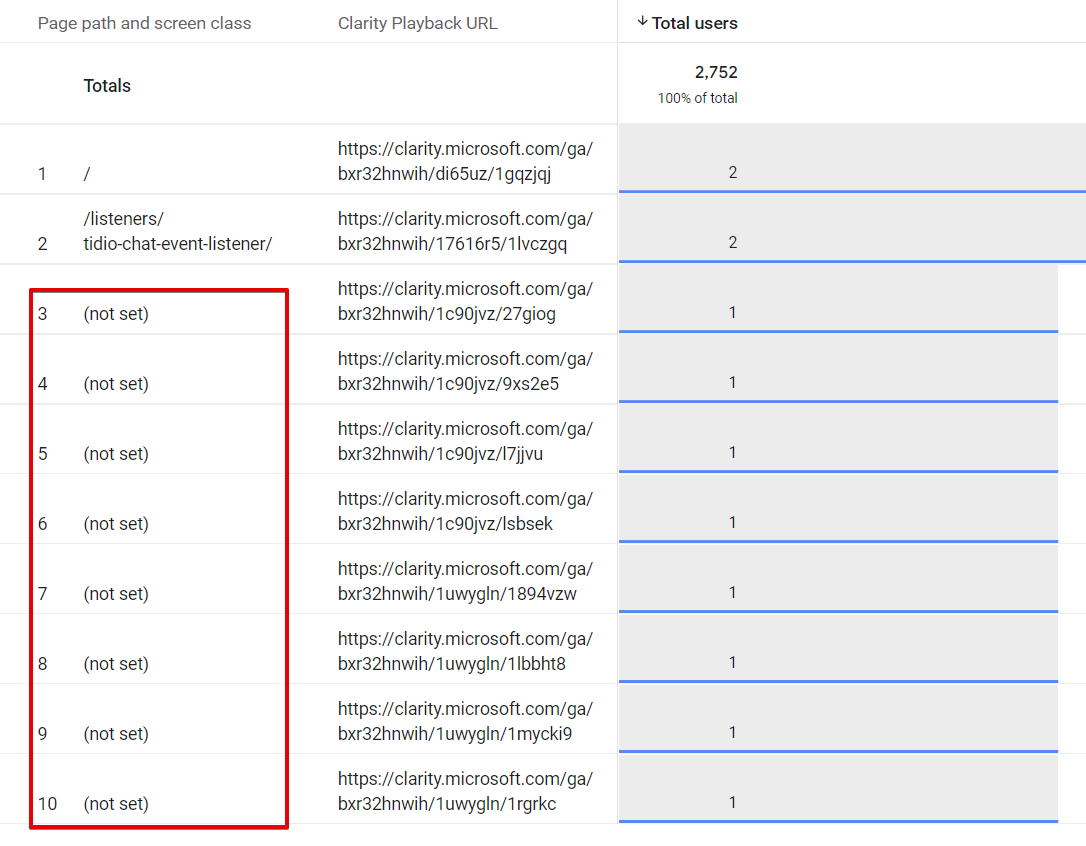
The integration between native Google Analytics and Microsoft Clarity can sometimes result in the page path being reported as “(not set),” even when the Clarity playback URL is accessible. To illustrate this issue, here is an example event featuring the “Clarity” GA4 event, which includes the session recording playback URL as a GA4 event_parameter.

Here is the same not-set example, but without the “Clarity” event in the report.
In my experience, when attempting to access the playback URL in Google BigQuery using GA4 data, I have found myself resorting to joins instead of utilizing a simpler SQL query.
How to Resolve These Issues?
The best approach is to complement the native integration with a manual integration. To do this, you will need to;
- Capture the session recording playback URL
- Send it as a parameter.
- The Microsoft Clarity userID (optional and only used in unique cases)
here is how to do it
- Capture the Session Recording Playback URL:
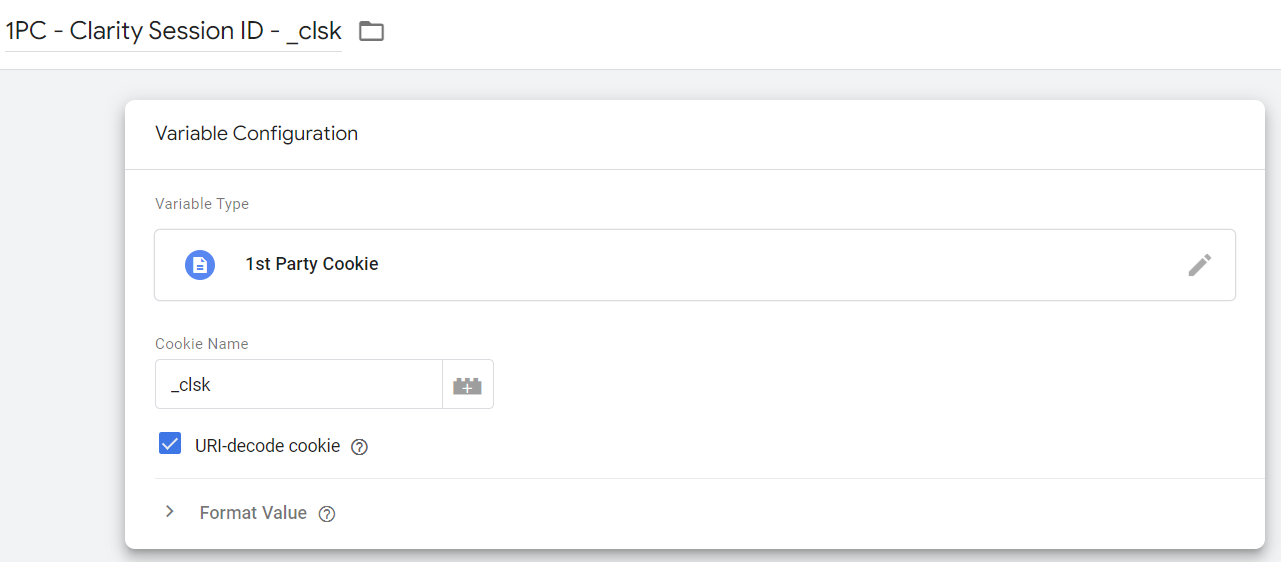
- Create two 1st Party Cookie variables for the session and user IDs: “_clsk” for Session ID and “_clck” for the user ID.
- In Google Tag Manager, navigate to the variables section and create new variables under “User Defined Variables.”
- Choose “1st Party Cookie” as the variable type and enter “_clsk” and “_clck” as the cookie names.
- Ensure the “URL-decode cookie” option is selected.
- Save the new variables.
The “User ID” cookie variable configuration.

The “Session ID” cookie variable configuration.
2. Obtain the Recording for the User’s Session:
The Microsoft Clarity session playback URL follows this format: “https://clarity.microsoft.com/player/” + Clarity_Project_ID + “/” + Clarity_User_ID + “/” + Session_ID.
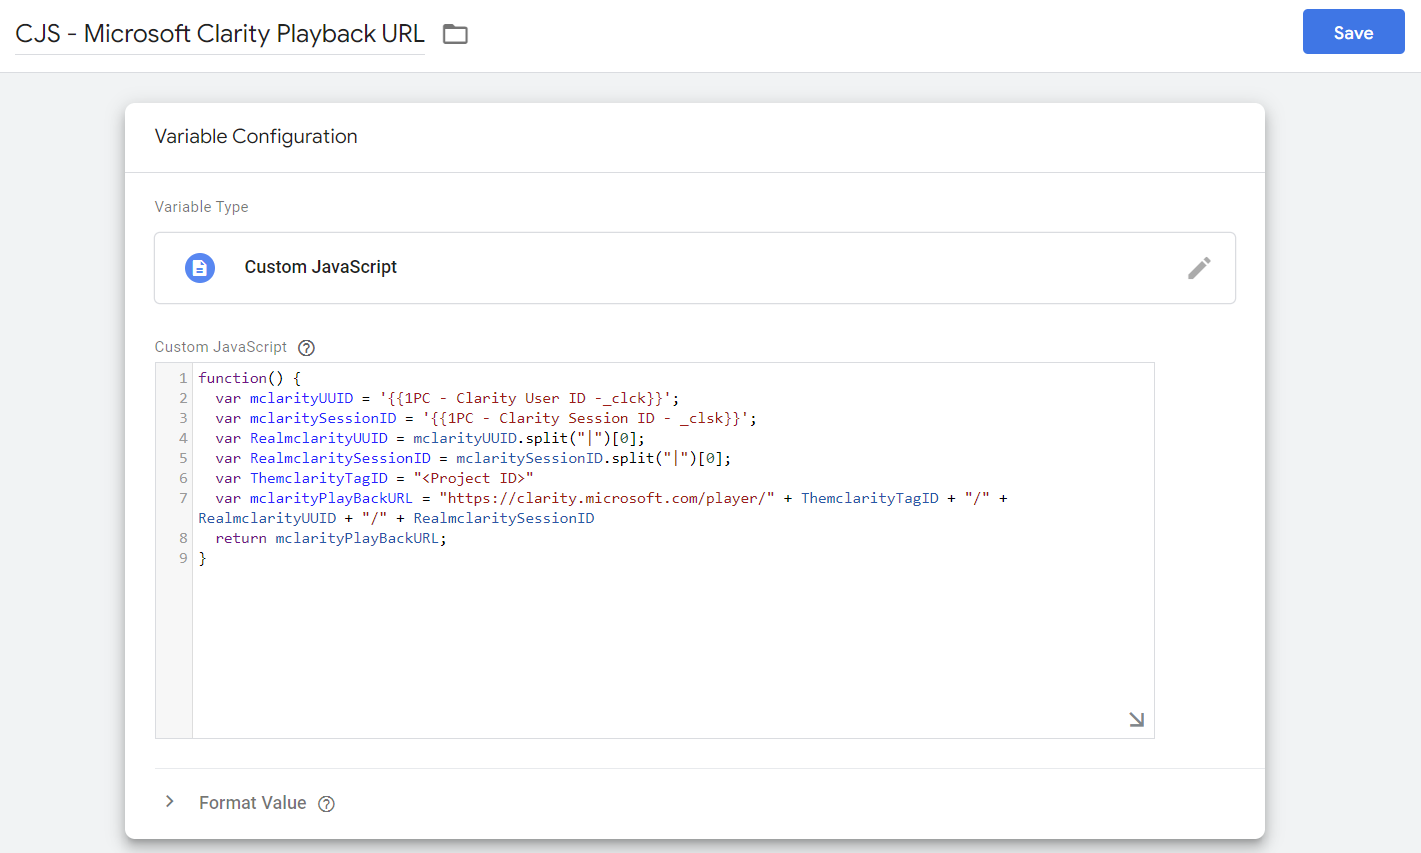
You can use custom JavaScript and the first-party variable cookies created in the previous step to retrieve the recording playback URL for the user’s session.
function() {
  var mclarityUUID = '{{1PC - Clarity User ID -_clck}}';
  var mclaritySessionID = '{{1PC - Clarity Session ID - _clsk}}';
  var RealmclarityUUID = mclarityUUID.split("|")[0];
  var RealmclaritySessionID = mclaritySessionID.split("|")[0];
  var ThemclarityTagID = "<Project ID>"
  var mclarityPlayBackURL = "https://clarity.microsoft.com/player/" + ThemclarityTagID + "/" + RealmclarityUUID + "/" + RealmclaritySessionID
  return mclarityPlayBackURL;
}
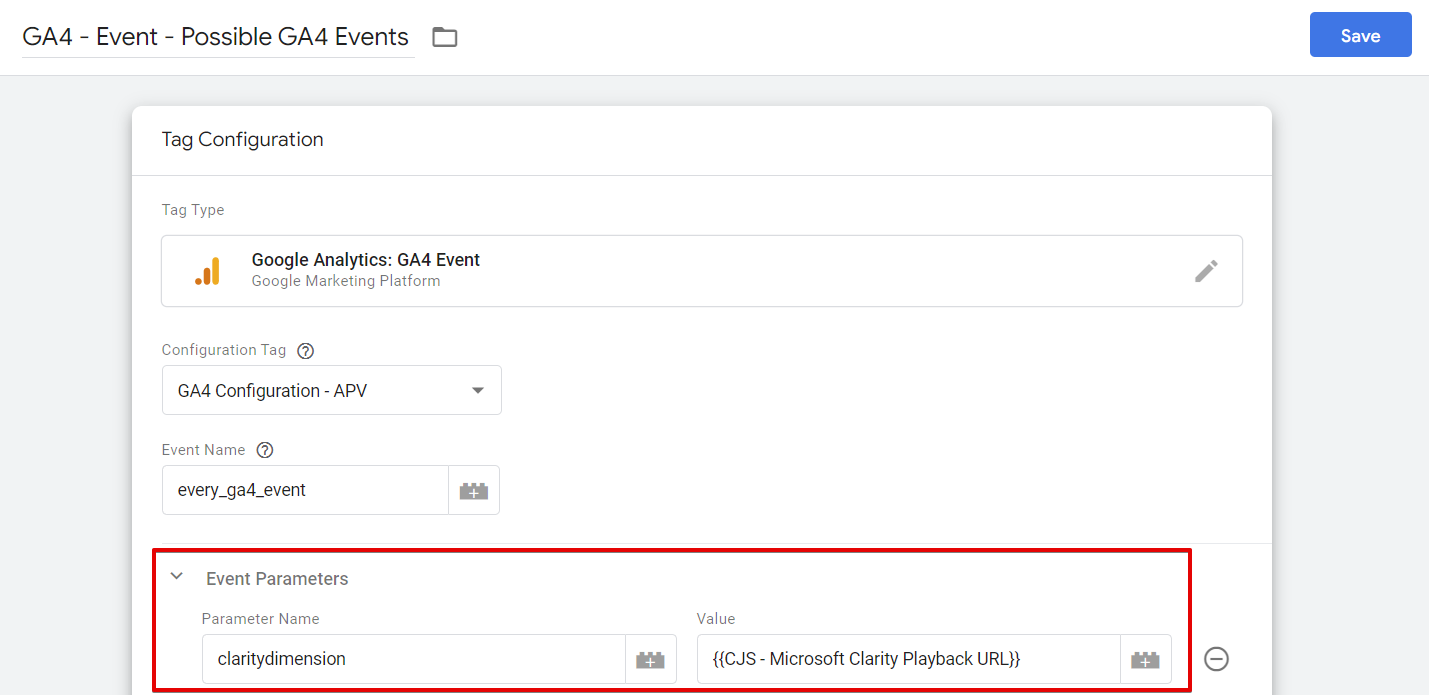
3. Sending the Data to Google Analytics (GA4)
Let’s explore how we can send the data to GA4. Since GA4 operates on an event-based measurement model and lacks a session scope dimension, we need to send the session playback URL as an event parameter. There are two approaches to achieving this. However, I recommend both:
First, we can send the data only on critical, conversion, and error events, ensuring accessibility at each of these events.
Alternatively, we can include it as a parameter in all GA4 event tags within Google Tag Manager. However, please note that it might not be available on the “page_view” event because Microsoft Clarity may not have fully loaded at that time. Also, due to a race condition, GA4 might load before Microsoft Clarity.
While you might consider not using the config tag, it doesn’t function the same way as the Google Analytics Settings variable in Universal Analytics.
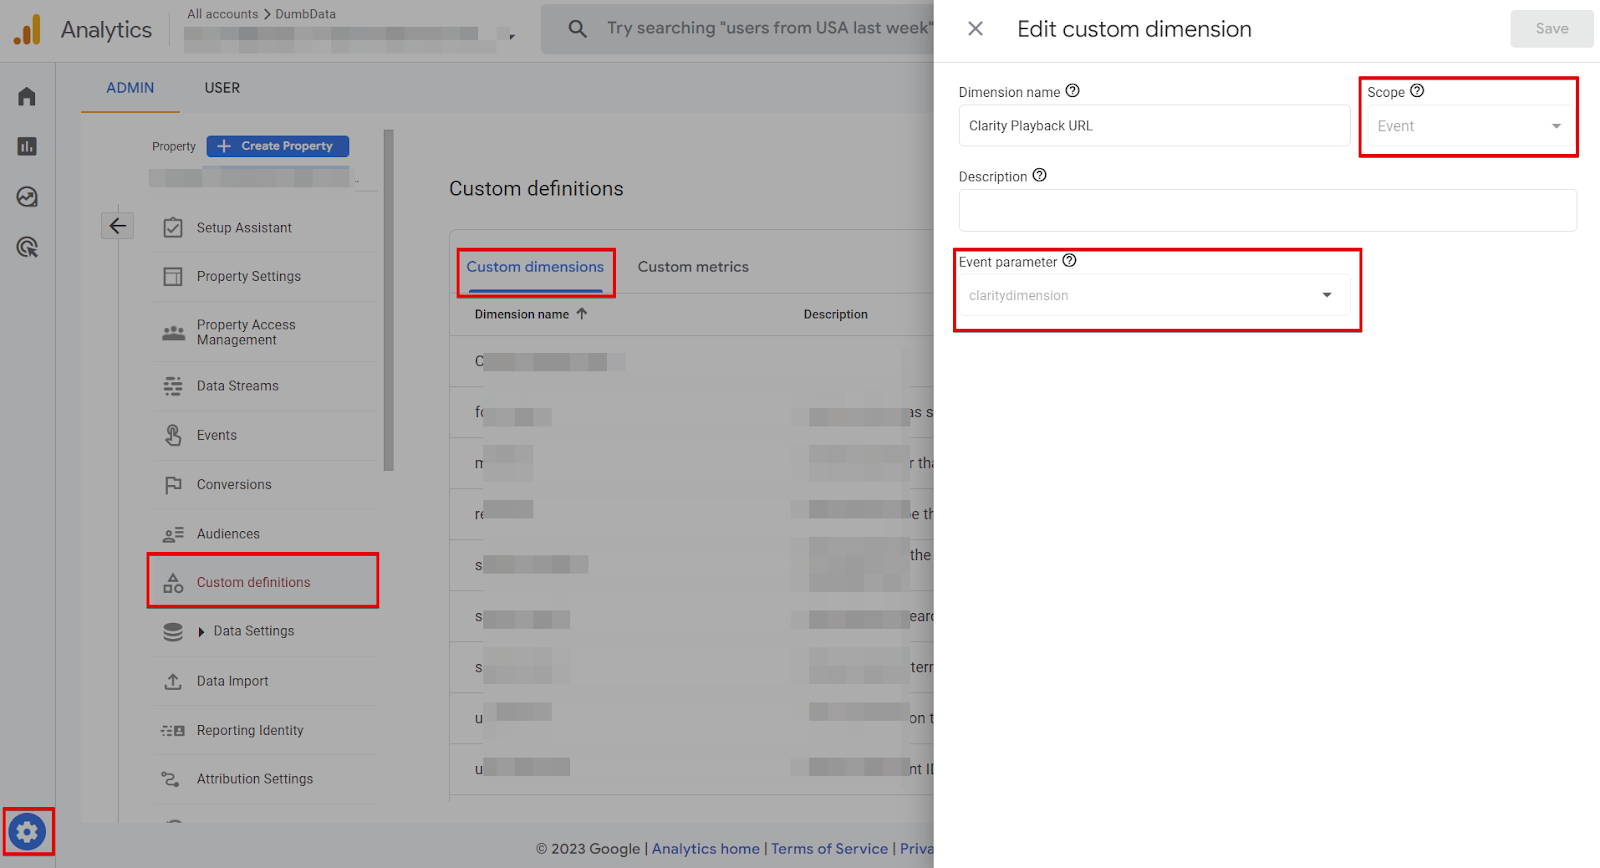
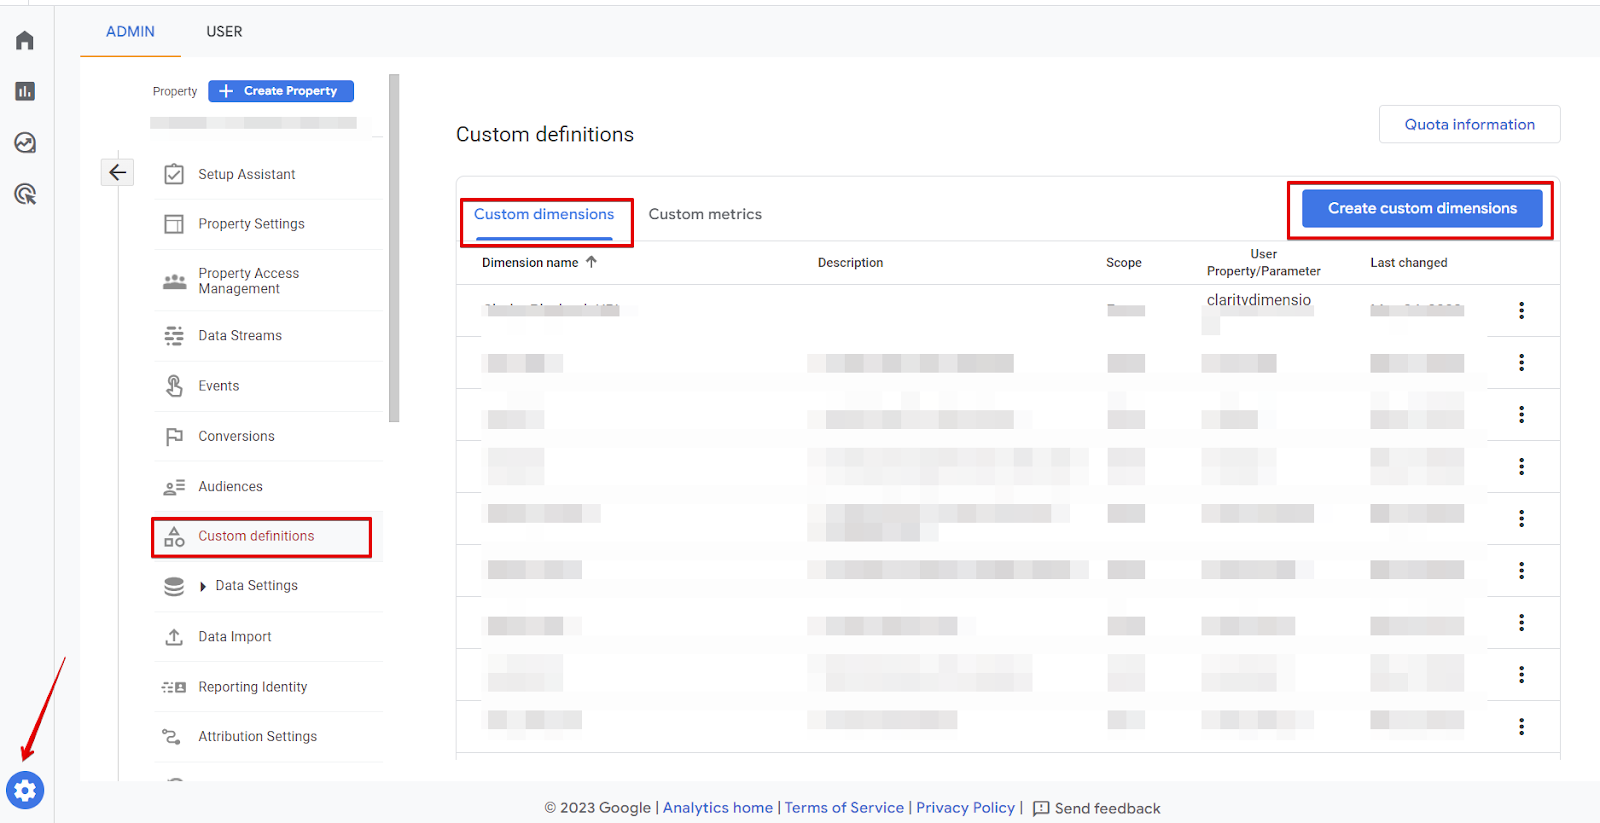
4. Registering the Parameter in Google Analytics 4
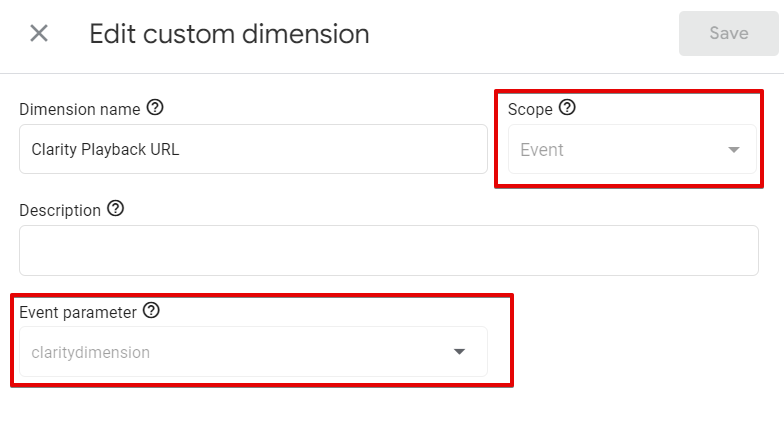
Suppose you haven’t registered the event scope custom dimension “claritydimension,” which is a parameter passed by the native Microsoft Clarity and GA4 integration and used in GA4 events. In that case, you’ll need to register it in GA4. Access the GA4 admin, navigate to the custom dimension section, and add the parameter there.
Add the “claritydimension” as the event parameter and select “Event” as your scope.
For Integration with other measurement stacks, business CRM and ticketing software, you can refer to this blog post on “linking session recording tools with your business stacks” It offers code examples and instructions for integrating Microsoft Clarity with Piwik Pro, Mixpanel, business CRMs, and ticketing systems.
Conclusion of This Lengthy Article
Congratulations! We have reached the end of this comprehensive guide on Microsoft Clarity, where we have covered various aspects such as account creation, integration, analysis, best practices, and much more.
As I mentioned earlier, I have two gifts for you to make your experience with Microsoft Clarity easier and more collaborative. The first gift is the Microsoft Clarity instrumentation worksheet, which will assist you in the setup process. The second gift is an audit or checklist that ensures you get everything in your setup.
And if you’re looking to just get started right now, this short PDF guide will help you create your Clarity account and get it installed on your site. Don’t worry, there’s a link to the full guide so you can come back here for more once you’re ready for more.
Now, it’s time to bid farewell. Feel free to leave a comment, and until then, happy measuring!

")


Trackbacks & Pingbacks
[…] introduction to what Microsoft Clarity can […]
[…] take a look at an example of simple two-step funnel in Microsoft Clarity for a lead generation […]
[…] Root and Branch focuses on SEO and analytics and uses tools like Google Analytics, Google Tag Manager, and Microsoft Clarity. […]
[…] Microsoft Clarity is a digital experience optimization tool that assists with various tasks such as e-commerce, lead generation, and analyzing user behaviour on your website. It helps you understand how users interact with the content you publish. […]
[…] you are new to Microsoft Clarity, check out this in-depth blog post about the tool. Additionally, you can read this guide if considering integrating Microsoft Clarity […]
[…] a tag manager, web analytics tools like Microsoft Clarity and Google Analytics require code to be installed in the backend of a website. The same thing goes […]
[…] called Clarity that works well in partnership with Google Analytics? It’s true. Check out the full Clarity guide or the much shorter Clarity vs. Google Analytics […]
[…] written by Zack Duncan who enjoys SEO, Google Analytics, Google Tag Manager, and other tools like Microsoft Clarity. He’s also a real data driven weirdo. For more of this type of stuff, you can check out the […]
[…] This was written by Zack Duncan who is finding himself to be a real data driven weirdo at Root & Branch. The company focuses on SEO and analytics and uses tools like Google Analytics, Google Tag Manager, and Microsoft Clarity. […]
[…] if you are expanding beyond Google Analytics, this comprehensive Microsoft Clarity tutorial and video quick-start guide might be […]
[…] publishing a detailed Microsoft Clarity tutorial, I’m back with another article that provides comprehensive documentation on integrating Microsoft […]
[…] a comprehensive picture of all Clarity can do, check out this in depth Microsoft Clarity tutorial. You can also check out this PDF download for instructions on how to quickly create a free Clarity […]
[…] time to get more comfortable with GA4. You might also consider learning a new (and free) tool like Microsoft Clarity that can work as a great supplement to Google […]
[…] You can also use Tag Manager to deploy other code-based tools on your website. You can find one example of that in this Microsoft Clarity set up guide. […]
[…] If you use Microsoft Clarity as part of your analytics stack, you can integrate it with Google Analytics 4. Clarity is a robust tool but the basic set up is pretty straightforward with the help of Google Tag Manager. If that sounds interesting, you can learn more in this Clarity tutorial. […]
Leave a Reply
Want to join the discussion?Feel free to contribute!