
GA4 Explorations: Advanced GA4 Reporting
GA4 Explorations help to uncover deeper insights in your data. This reporting functionality is built into Google Analytics 4, but it takes some getting used to. We’ll review how it all works in this Explorations guide.
We’ll cover 5 things in this blog post.
- A brief overview of reports in GA4, including Standard reports vs. “Explorations”
- Types of Explorations
- Segments, Metrics and Dimensions in Explorations
- Variables and Tab Settings
- Sharing Explorations with Others
You can read on below to get started, or check out this embed below if you’d prefer a video review.
A Quick Overview GA4 Reports
GA4 reports are much different than reports in Universal Analytics (also called GA3). It is just one of multiple differences between Google Analytics 4 and UA. Many differences stem from the fact that the data model is completely new. In GA4, everything is “event-based”, which means that some of the reports in UA based on sessions and pageviews are simply not available.
In GA4, reports are bucketed in two main areas: “Standard reports” and “Explorations”. Here is a detailed guide to using and customizing GA4 Standard Reports if you want to start there. This guide here will be all about Explorations.
What Are GA4 Explorations?
According to Google, Explorations is a collection of advanced techniques that go beyond standard reports to help you uncover deeper insights about your customers’ behavior.
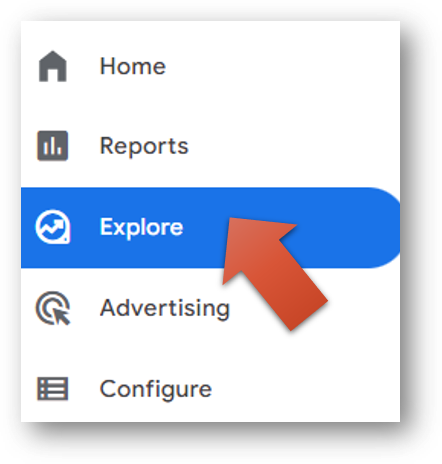
As you can see below, you can navigate to Explorations by selecting “Explore” from the left-hand menu item in GA4. Explorations sit immediately below the Standard Reports.
What Explorations Are Available?
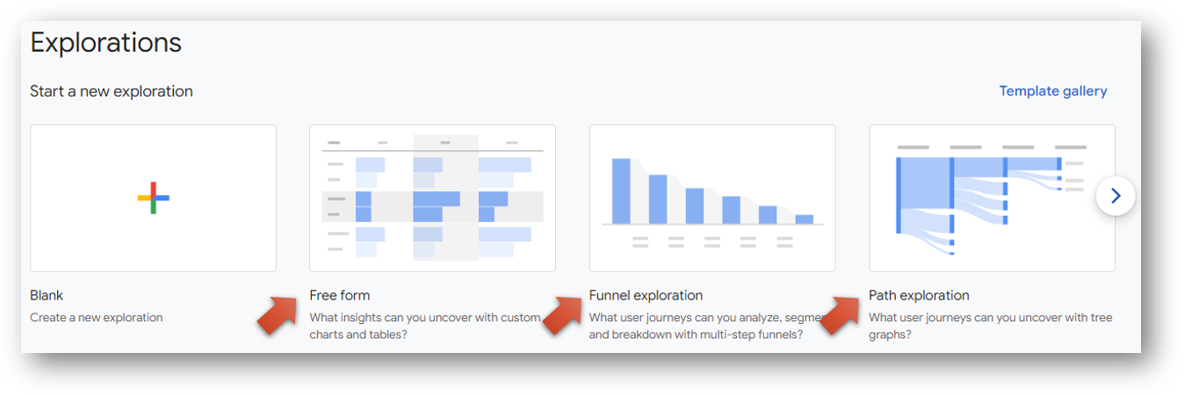
After navigating to Explorations, you’ll notice there are multiple options before you.
You can choose to create a “Free form” report, build a “Funnel exploration,” or use the “Path exploration report.” The last of those is a personal favorite of mine, and it represents an objective upgrade over the comparable Behavior Flow report in UA. The other two options are to look at other pre-built templates by using the “Template gallery” (see above the Path exploration at right in the image below), or you can start from a “Blank” canvas and build your own Exploration from scratch.
For our purposes here, we’ll discuss adding segments, metrics, and dimensions in the context of a Blank exploration.
Segments, Metrics, and Dimensions in Explorations
When we’re creating an Exploration from a Blank canvas we need to have a plan for what we want to analyze. The “stuff” that goes into our report is a combination of segments, metrics and dimensions. Metrics and dimensions are both required. Segments are optional, but can be a powerful way to dive deeply into our data.
By way of example, let’s talk about a real use case for the Root and Branch site. We’ve been creating more content over the last 6 months and we want to understand what kind of impact that might be having over time in terms of engagement metrics. We are specifically interested in how the impact might look when we analyze visitors who come to the site from Organic Search (SEO) vs. Organic Video (clicks from YouTube videos) vs. all other traffic channels.
Let’s start with segments and see how they fit in.
What Are Segments in Google Analytics?
A segment is a subset of your Analytics data that can be used in Explorations.
The example Google uses in their official documentation is a geographic segment. For example, one segment of your users might be from a particular country or city that is especially important to your business. In the sample report in the embedded video above (and in the image below), there are 3 segments based on how visitors arrived at the Root and Branch website.
- Segment 1: visitors coming from Organic Search
- Segment 2: visitors coming to the site from Organic Video (clicks from video descriptions on YouTube channel)
- Segment 3: all other visitors not from Organic Search and Organic Video
You can see immediately below that we’ve built 3 segments to use in our Exploration. The embedded video reviews the entire process for creating segments or you can read more about Google Analytics segments here.
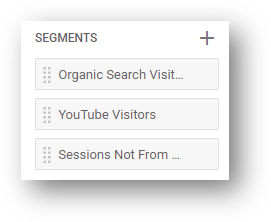
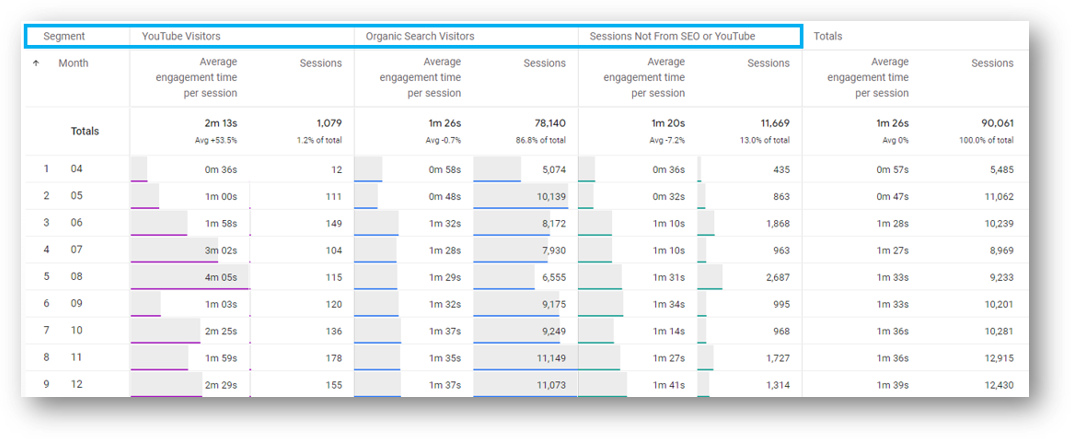
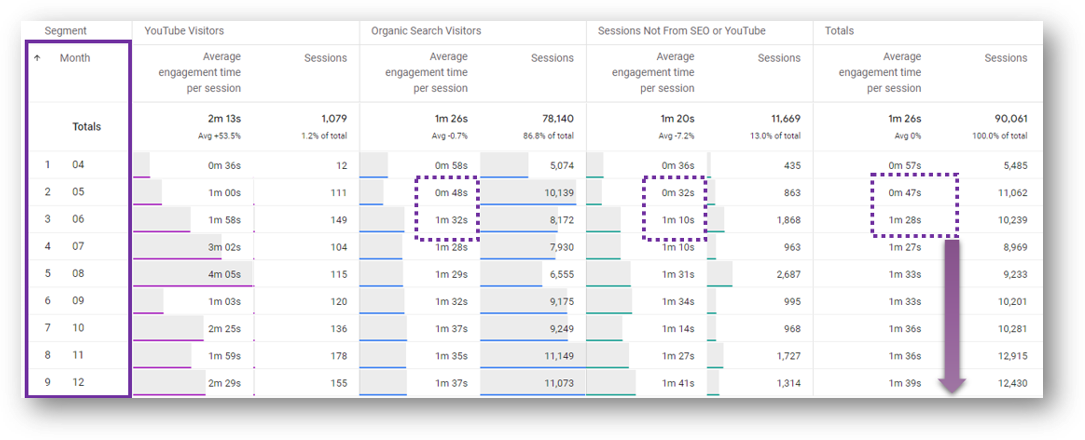
You can see our 3 segments below in the blue box. They allow us to analyze our data at a more granular level than we would otherwise be able to. At the far right of the report, you can also see that GA4 automatically puts in a Total for us. Thanks GA4!
What Are Metrics in Google Analytics?
Metrics are quantitative measurements. They are the numbers in our Google Analytics data.
Here are some examples of metrics: number of sessions, bounce rate, number of conversions, number of events, average engagement time.
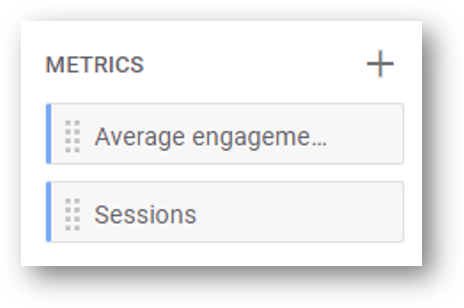
For our purposes for the Root and Branch site analysis, we want to understand if the increased site content is having an impact in terms of visitor engagement. These are the two metrics that we’ll use to help measure that.
- Metric 1: Sessions (is the session count increasing?)
- Metric 2: Average engagement time (are visitors spending more time engaged during an average session)
We can add those two metrics so they are available to use in our report.
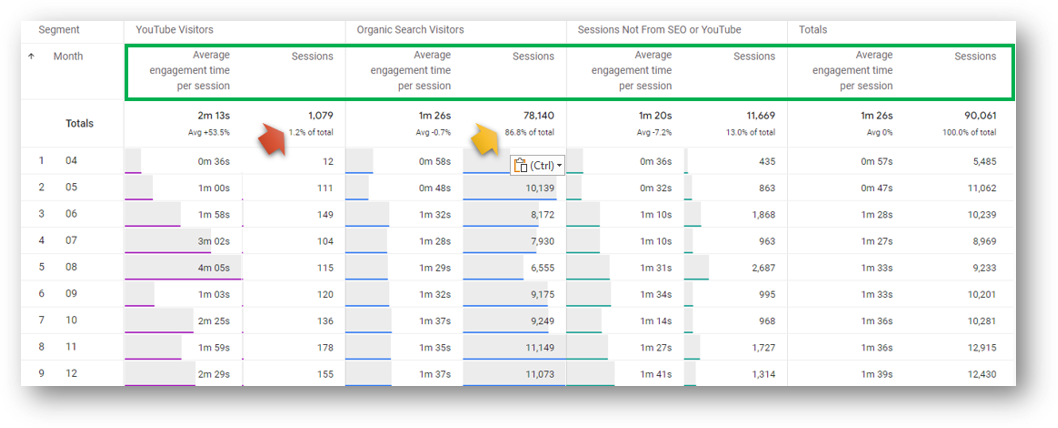
Check the green box in the report below to see our metrics in our Exploration. Because we have multiple segments, we see the same two metrics for each. Google Analytics 4 will also put in helpful subtotals that help us digest our metrics more quickly than we might otherwise. For example, we can see that our segment of YouTube visitors is only 1.2% of our total visitors (red arrow), while visitors coming from Organic Search account for over 86% of all visitors.
What Are Dimensions in Google Analytics?
Dimensions are attributes of our data. Dimensions are the ways that we slice and dice and data to uncover the insights we are looking for.
Some examples of dimensions are city, country, date, week, and month. It might be great to know a number like your total conversion count. That quantitative number is a metric. But that metric becomes especially helpful when break it down by a dimension like city or week or month. That allows you to know information that can be more actionable, like the number of conversions coming from key markets or the trended number of conversions over time. Please note, it’s possible to build segments based on dimensions.
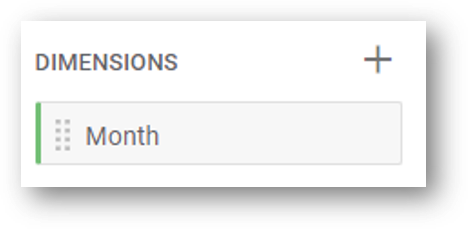
For our purposes for the Root and Branch site analysis, we want to look at our metrics and segments over time. Have the site engagement metrics been changing as we’ve increased content creation frequency? As such, we only need one dimension. We’re going to use month, but we could also use week if we wanted to take an even more granular view of our data.
- Dimension 1: Month (do we see changes in performance on a month over month basis?)
We can add this dimension to our GA4 exploration. If we preferred to use date or week we could have added those dimensions instead.
What Does Our Final GA4 Exploration Look Like?
Check out the Exploration below where we see report data broken down by the dimension in the solid purple box at far left. This level of granularity allows us to see that a big increase in average engagement time took place between May (month 05) and June (month 06). You can see that in the dashed purple boxes showing the increase took place across all of our segments. If you look at the purple arrow in the bottom right of the report you can see that the average engagement time has continued to steadily increase in the subsequent months following June.
Now we have a full picture that we can analyze thanks to our segments, metrics, and our single dimension. When we add these elements to our GA4 exploration, we need to understand terms called Variables and Tab Settings.
Variables and Tab Settings
Let’s make this part simple. Variables are the total number of segments, metrics, and dimensions available in our report. Tab settings are the specific segments, metrics, and dimensions we choose to have displayed in our Exploration.
Variables in GA4 Explorations
The “Variables” in a GA4 exploration are simply the segments, metrics, and dimensions that we have available to work with. How do we make them available? For segments, we build them using the segment builder tool available in Explorations. For metrics and dimensions we simply choose them from a list of what is available in our GA4 property.
In the image below, look at the small “+” signs to the right of the red arrows for segments, metrics, and dimensions. Hitting these “+” signs allows you to bring these pieces of data into the Exploration area. If you haven’t watched the video above, this might be a good time to do so. It shows how to build segments and choose dimensions and metrics from what is available.
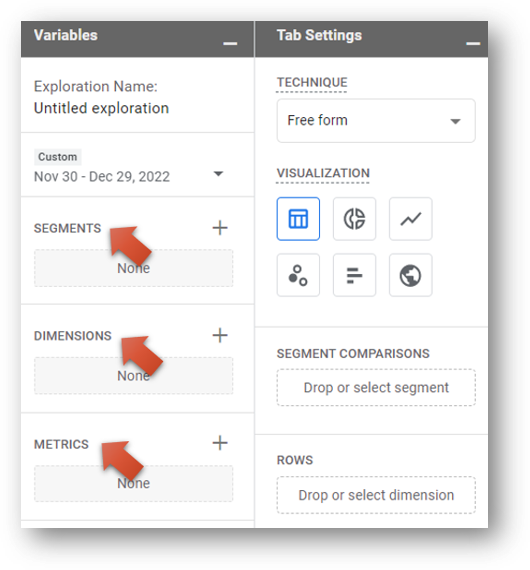
The Variables section is also where you can give your Exploration a name and choose your date range.
Tab Settings in GA4 Explorations
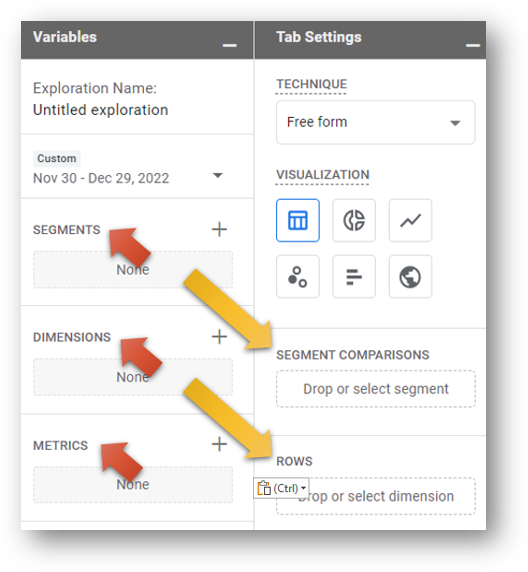
Simple adding data to your Variables is not enough. To actually visualize your data, you need to move those segments, dimensions, and metrics to your Exploration by adding them to your Tab Settings.
You can do this either by clicking and dragging them to the proper place in the Tab Settings (see the yellow arrows below), or you can simply double click them from Variables and they will automatically added to the proper place in Tab Settings.
Tab Settings is also the place where you can change your Visualization type. For example, you might want to use a table or a bar chart or a bubble chart depending on what you are trying to show with your data. Please note, not all visualization types work equally well in all situations. You need to choose based on the specific Exploration you are building.
Once you have your Exploration fully built, it’s likely time to share it with other stakeholders on your team.
How to Share Explorations?
Sharing Explorations is not currently a smooth process. Fortunately, it’s also not incredibly challenging. When you finish working on your Exploration it will be automatically saved.
You’ll see the saved Exploration in the primary Explorations menu displayed in a list below the options to create a Blank exploration or use Funnel Analysis or Path Exploration. Check the heading above called “What Explorations are Available?” if you forget what that looks like.
You’ll see a vertical 3 dot icon to the right of your named Exploration. Hit it. Now select “Share” from the list of available options.
![]()
![]()
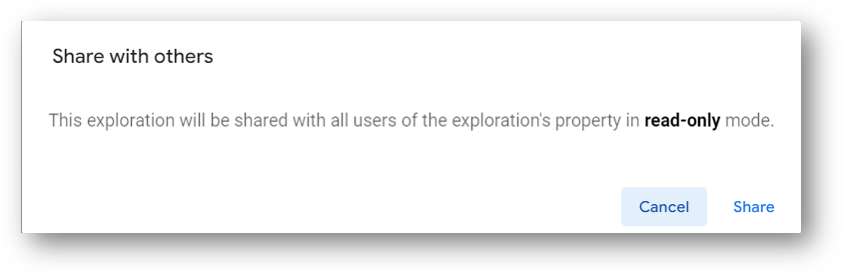
You’ll see this warning that your report will only be shared in read-only mode. That’s a bummer but it’s our only option. So hit “Share”.
How Can Others Use My Shared Exploration?
Sharing in read only mode is a drawback. You can’t change basic settings in a read-only Exploration. Even something as simple as the date can’t be changed. Fortunately, there is a simple workaround. Here is what you should tell someone whom you’ve shared an Exploration with.
- Hit the 3 dot icon to the right of the report that I just shared with you. (Yes, this is same vertical 3 dot icon that you had hit previously to share it).
- Hit “Duplicate.”
- Save the report with a name you’ll recognize.
- Delete the read-only version of the report.
- Edit and analyze away.
That’s it!
More GA4 Reporting
That wraps things up for the GA4 Explorations. These far more in depth than the quick and easily accessible reports that provide highlights on performance at a glance. Instead, they require us to have a plan for what we want to analyze and then choose our segments, metrics, and dimensions accordingly. From there, we add them to our Exploration through Variables and Tab Settings and we’re off to the races.
If you’re interested in going even deeper with GA4 reporting, you may be interested in visualizations with Looker Studio (formerly called Google Data Studio) and Google BigQuery.
Wrapping Up
Looking for something else? Feel free to leave a note in the comments or on the Root and Branch YouTube channel at youtube.com/@rooted-digital. We’re always looking for new content ideas!
Don’t forget that Universal Analytics data will no longer be processed in that platform beginning July 1, 2023. In other words, now is the time to get more comfortable with GA4.
About Root & Branch
Root & Branch is a certified Google Partner agency and focuses on paid search (PPC), SEO, Local SEO, and Google Analytics. You can learn more about us here. Or hit the button below to check out YouTube for more digital marketing tips and training resources.


")
")


Trackbacks & Pingbacks
[…] so you can learn more about how your audience interacts with your site. You can do that in the Explorations reporting area of […]
[…] You will still be able to access some event parameters in GA4 Explorations without custom […]
[…] building a custom Exploration, add the “Search term” dimension to your report so you can see the individual GA4 […]
[…] an article showing how you can use GA4 Explorations to build simple custom […]
[…] can use GA4 Explorations, what Google calls “advanced reporting features” to build your own […]
[…] an article showing how you can use GA4 Explorations to build simple custom […]
[…] When a user visits a website, the analytics.js library creates a first-party cookie that stores information such as the user’s unique identifier, session details, and website interactions. This data is then sent to the Google Analytics servers, where it is processed and transformed into reports. That is the data that we can then see in our GA4 reports and Explorations. […]
[…] can user ga_session_number to create segments in your Explorations. Here’s what that looks […]
[…] These “advanced reporting” features are weird at first. But once you know how to look for the dimensions, metrics, and segments that you need, they can be quite helpful. Here’s a guide to GA4 explorations. […]
[…] If you do go through the process of registering these custom dimensions, here is what you will see when you select your dimensions in a GA4 Exploration. […]
[…] rate or User conversion rate as metrics in Explorations and Standard reports. If you’re building an Exploration, this is what it will look like when you search for those […]
[…] How we can use regex for GA4 Explorations? […]
[…] Here’s an example of how to use GA4 Explorations. […]
[…] get more detailed information on your Returning Users in GA4, you’ll need to use the Explorations reporting feature. From there, you can create a custom report that access the “New / […]
[…] go deeper into Explorations, click the image below or this link to the GA4 Explorations guide on this […]
Leave a Reply
Want to join the discussion?Feel free to contribute!